The Gold Rush started in Idaho Springs Colorado, 13 miles down the road from where we have our home base for our mountain vacation in Georgetown.
Georgetown, along with the next town of Silver Plume were a big part of that mining craze. Now designated the Georgetown-Silver Plume Historic District, the towns had a combined population of over 4000 people in 1880. Now they are home too just 1200. Back then the area was a silver mining camp and there was a railroad loop between them.
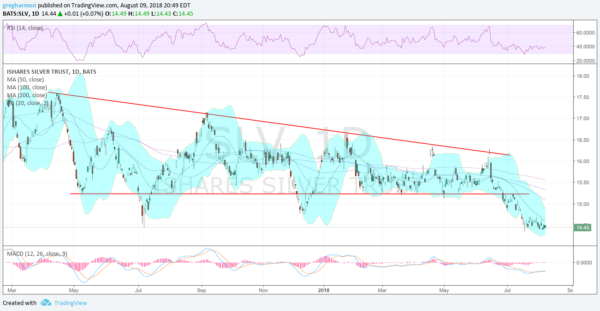
But with that it seems like a good time to check in on Silver prices. The chart below shows the price of the Silver ETF over the last 15 months. From an April 2017 high it has made a series of lower highs, with the last one in June this year. It has also found support roughly at the same spot with the exception of two periods where it overshot in July and December last year. That created a rough descending triangle.
The price broke down below support again in June then quickly came back to retest the breakdown level. It failed there this time and reversed lower into July. By the middle of the month it was consolidating, moving sideways, but well short of the target from the breakdown to 12.75. Momentum is mixed with the RSI stalled and moving sideways at the mid line and then MACD slowly diverging to the upside but still negative. The Bollinger Bands also continue to point lower. All signs suggest more downside price action for Silver. I guess if we find some we should sell it quickly.
The information in this blog post represents my own opinions and does not contain a recommendation for any particular security or investment. I or my affiliates may hold positions or other interests in securities mentioned in the Blog, please see my Disclaimer page for my full disclaimer.

