The global debt as a percentage of the GDP has increased from around 100 percent in 1950 to almost 200 percent in 2007 and to 225 percent in 2017. The world is more indebted than it was when the global financial crisis burst. Isn't this economic madness? We invite you to read our today's article about the debt trap and find out what it means for the gold market.
Do you remember 1990s when Friends reigned on TV, while the U.S. biggest problem was the Lewinsky scandal? Interest rates were above 5 percent, GDP grew above 3 percent annually, while the public debt was on the decline. Today, we are in a completely different situation, living in a world of slow growth, low real interest rates and ballooning debt levels. Actually, the world might be caught in a debt trap of central bankers' own making. What is a debt trap and how does gold behave in such settings?
The debt trap is a situation in which a borrower rolls over the debt because he or she is unable to repay the principal. The cause - but also a consequence - of the debt trap are ultralow interest rates. The cheap credit makes debt financing more attractive, so everyone - households, corporations and governments - takes on more debt. Indeed, the global debt as a percentage of the GDP has increased from around 100 percent in 1950 to almost 200 percent in 2007 and to 225 percent in 2017.
It is true that ultralow interest rates make debt financing more affordable, but the accumulation of debt would require more spending on servicing the debt. In such an environment, any increase in interest rates could be detrimental for borrowers.
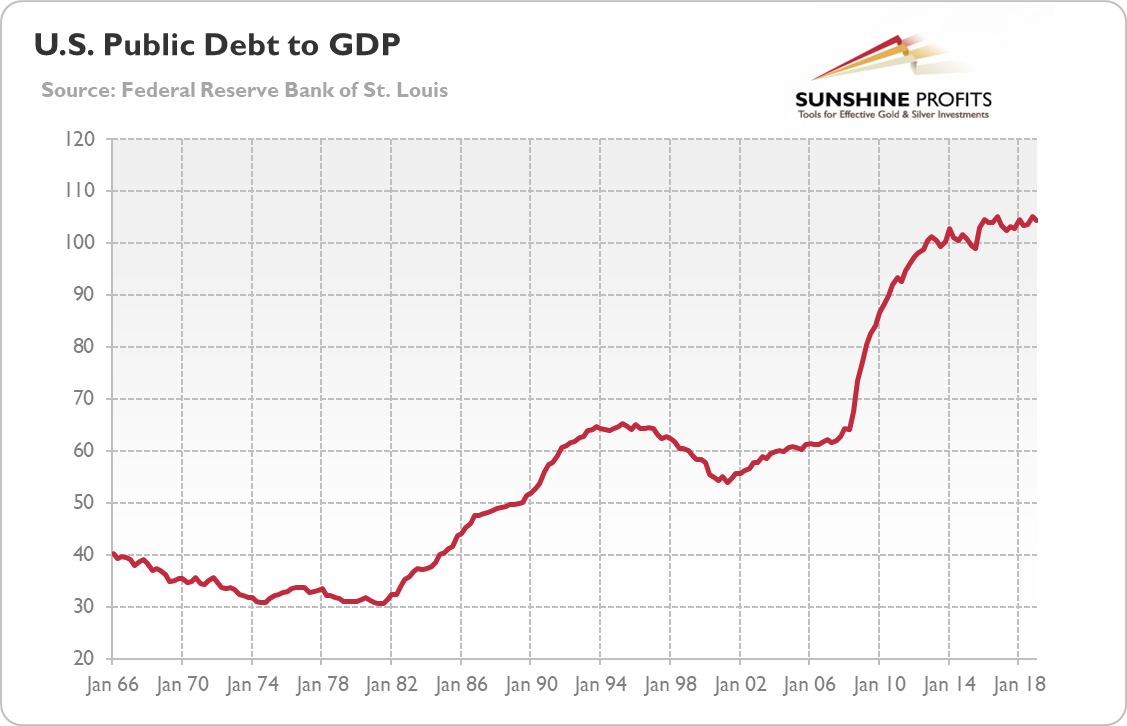
In particular, the zero interest rate policy adopted by the Fed in the aftermath of the Great Recession encouraged the government to issue more debt. Thus, the federal debt soared to levels unprecedented during peacetime. As the chart below shows, the U.S. total public debt as a share of GDP surged from 63 percent in Q4 2007 to 104 percent in Q1 2019.
Chart 1: US public debt as a % of GDP from Q1 1966 to Q1 2019

But the relationship between the low interest rates and public debt is two-sided. High public indebtedness makes a return to a more normal interest rates much more difficult, as it would raise the costs of servicing existing debt for the governments. They would have to either increase taxes or cut spending, which they would prefer to avoid. This pressure on monetary policy leads to the trap of low interest rates and high government debt levels.
Now, the key point is that high government debt crowds out private investment and finances otherwise untenable endeavors, reducing investment and hampering economic growth. It increases the risk of fiscal crisis and creates general uncertainty, lowering spending. In other words, low-interest rates begets low interest rates, too much debt and too little growth. It would be difficult to come up with a stronger fundamental combination for gold.
However, although high public debt is worrisome, investors should not overlook private debt. In a way, high private debt is even more dangerous. After all, the global financial crisis was caused partially by excessive mortgaging accompanied by offloading such securities into CDOs sold to unsuspecting investors, while the sluggish recovery was accompanied by household deleveraging.
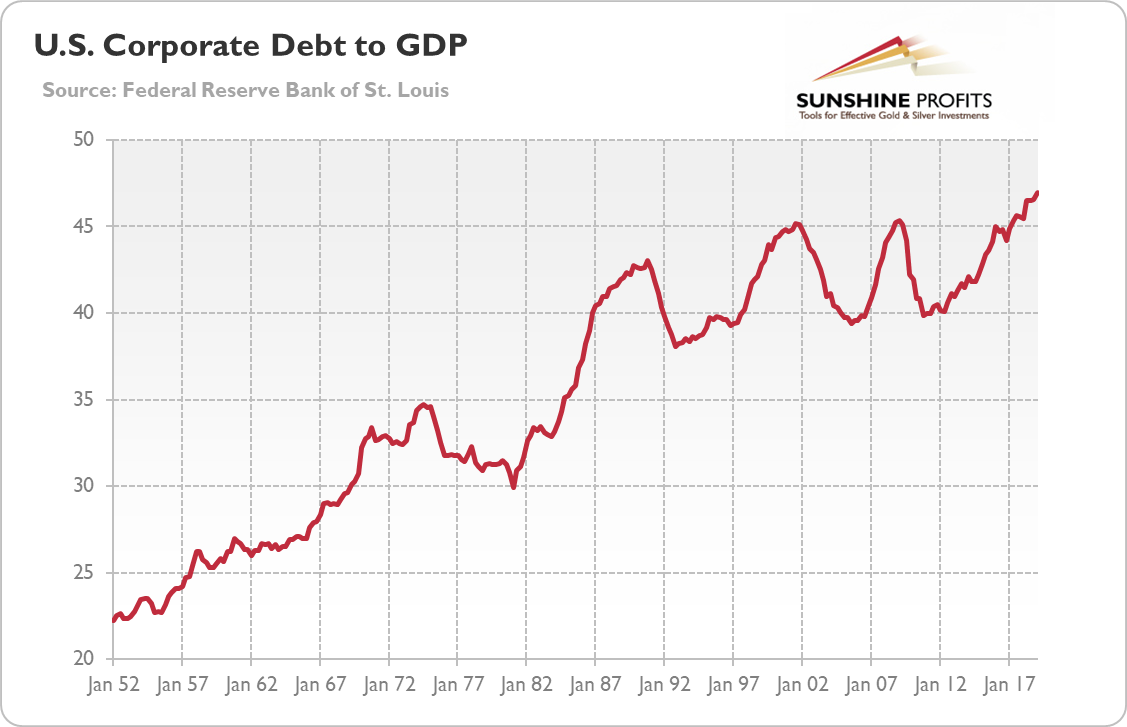
But now the most alarming - although unnoticed by many analysts who focus on other categories of debt - might be the high level of corporate debt. As the chart below shows, the U.S. corporate debt as a share of GDP (understood just as debt securities and loans of large companies) jumped from 43 percent at the end of 2007 to 47 percent in Q1 2019, a record high. Total corporate debt is actually much higher, about 74 percent of the GDP.
Chart 2: U.S. corporate debt as a % of GDP from Q1 1952 to Q1 2019.

The problem is that many companies are more leveraged now than before the Great Recession, as their debts have risen faster than their profits. Actually, many managers borrowed money just to buy back shares and thus goose corporate profitability, not to grow the bottom line. And, what is perhaps the most disturbing is that today's universe of debtors include a higher proportion of riskier companies. In other words, the global average quality of bond issuers has declined in recent years. For example, in the U.S., the BBB-rated bonds constitute now about half of all investment-grade bonds, up from 31 percent in 2000. They are the lowest investment grade tier, just one downgrade away from being junk bonds. Once that happens, can you imagine what a forced liquidation of such holdings among institutions not allowed to hold junk would look like? Such companies are more sensitive to reduction in revenue, increase in interest rates, or any negative economic shock.
Now, it should be more clear why the Fed cut interest rates in July. It might be just the case that today's highly indebted economy simply cannot stomach interest rates at 2.5 percent. The developed world fell into debt trap, or an environment of low growth, low interest rates, and high debt. This macroeconomic background should be fundamentally positive for gold prices. Low real interest rates will support the yellow metal. The excessive indebtedness implies an elevated risk of an economic crisis. The central banks will not be able to normalize their monetary policies anytime soon, while the economies will not grow their way out from the high debts hanging over them as Damocles' sword. The politically attractive, if not the only possible, solution to the debt problem will be to inflate the real debt obligations away, making them easier to pay off in a depreciated currency - but if the governments choose this path, we would see high inflation, which would make gold to shine.
Disclaimer: Please note that the aim of the above analysis is to discuss the likely long-term impact of the featured phenomenon on the price of gold and this analysis does not indicate (nor does it aim to do so) whether gold is likely to move higher or lower in the short- or medium term. In order to determine the latter, many additional factors need to be considered (i.e. sentiment, chart patterns, cycles, indicators, ratios, self-similar patterns and more) and we are taking them into account (and discussing the short- and medium-term outlook) in our trading alerts.
