Recently I noticed the somewhat weird goings on regarding trading days of the month using a basket of 17 iShares single country ETFs. Specifically, I noticed that – inexplicably – all 17 ETFs showed a net gain on four specific trading days of the month since they started trading in 1996. This article builds on that original study.
Looking For A Few Good Days
A couple of initial points:
I should mention that in doing the testing on the 17 initial single country ETFs, I used all of the data – no out of sample testing, walk forward, etc. So if someone wants to shout “curve-fitting” I won’t really offer up a defense. Still, the main point that comes out of all the number crunching is that the vast majority of these ETFs make their money on the same trading days of the month. Which I found to be surprising – and quite compelling.
I am not sure the finished product represents an actual usable trading “system”, because it ultimately requires 2 trades each and every month month in 17 ETFs. Not sure how many people are up for that. Still, I found the results so compelling that I decided to write about them anyway – people can use, not use, adapt the idea as they see fit.
The data used was downloaded and the “adjusted price” was used.
No dividends, interest, taxes, fees or commissions are factored in. This is purely a test of price movement.
The Test
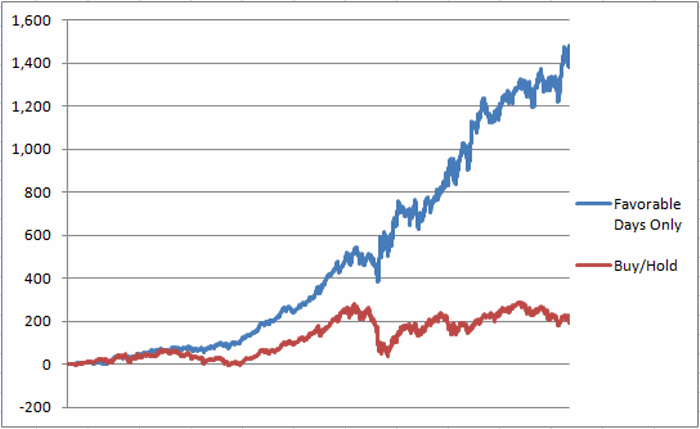
Figure 1 displays the results of the following test:
Buy and hold all 17 single country ETFs only on:
- The last four trading days of the month and the first two trading days of the next month
- Trading Days of the month #’s 9, 10, 11, 12, 13
- Each new trade starts with an equally weighted position in each of the ETFs.
- For testing purposes no interest is earned while out of ETFs.
(Versus simply buying and holding all 17 single country ETFs from 3/25/1996 through 7/6/2016.)
Figure 1 – Cumulative % return for holding all 17 single country ETF only during the “favorable day of the month periods (blue) versus buying and holding (red); 4/1/96 through 7/6/16
For The Record:
Buying and holding all 17 iShares single country ETFs since inception in 1996 gained +86%.
Holding all 17 iShares single country ETFs ONLY on the trading days of the month listed earlier (every month) plus annualized interest of 1% while out of stocks gained +1,585%.
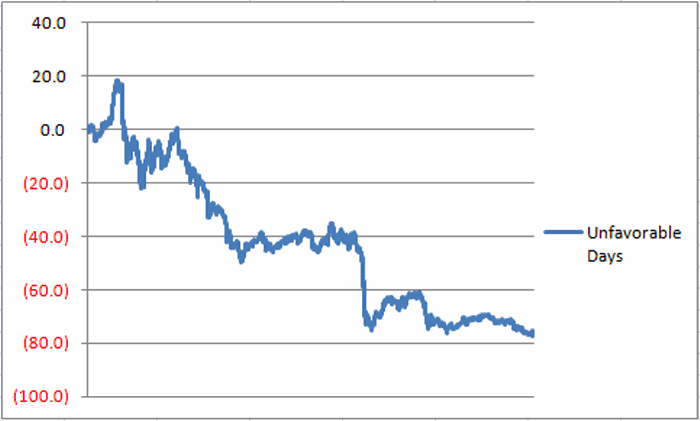
To get a better sense of things, note that Figure 2 displays the “growth” of equity that would have been achieved if a trader held all 17 ETFs only during “all other” trading days (i.e., only during all days other than those listed above). For the record, the net result is a loss of -87%.
Figure 2 – Cumulative % return for holding all 17 single country ETF only during the “non favorable day of the month periods”; 4/1/96 through 7/6/16
One Last Tidbit
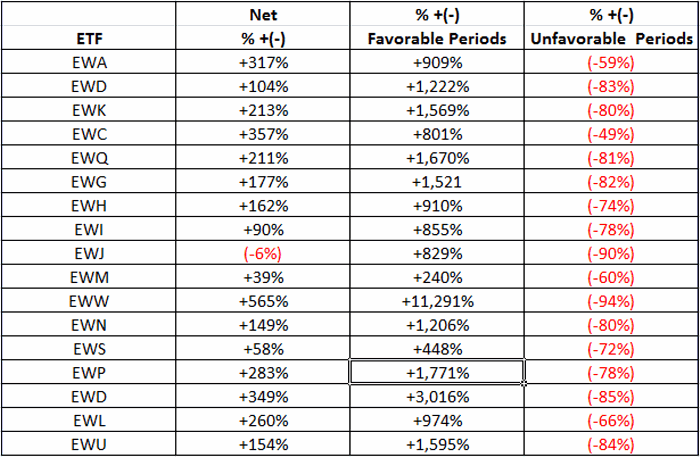
The final piece that made this so compelling to me is that all 17 single country ETFs vastly outperformed during the “favorable” days of the month versus the “non favorable” days as displayed in Figure 3.
Figure 3 – Net return, returns during favorable periods, returns during unfavorable periods for 17 single country ETFs; 4/1/96 through 7/6/16
Just to be clear, here is how to read the table in Figure 3:
Between 4/1/96 and 7/6/16 iShares MSCI Australia (NYSE:EWA) showed a net gain of +317%. However, holding EWA only on the trading days each month listed earlier would have generated a gain of +909%. Holding EWA only on all other trading days of the month would have generated a loss of -59%.
Note also that iShares MSCI Japan (NYSE:EWJ) showed a net loss over this 20+ year period (-6%). However, holding EWJ only during the favorable trading days listed above each month would have generated a gain of +829% (all other days lost -90%).
Summary
Is there something to “seasonality”? Well, at least when it comes to the various stock markets in countries around the globe, the short answer appears to be “maybe so”.

