Employment remains the paramount concern – for the economy, for the Fed, and for financial markets.
There are many employment indicators, but that can be more confusing than helpful. Rarely is there a consistent picture.
Can we find more clarity about employment?
Last Week's Theme Recap
I expected last week's theme to be focused on housing. That was basically correct. While I cited the Ukraine situation in the week's "ugly" award, it was a bigger topic of discussion than I expected. I teed up Calculated Risk and NDD for the housing debate. They have a charitable bet, which CR will win if starts or sales are up 20% YoY in any month during 2014. That is a pretty clean definition. NDD has the first update.
Readers are invited to play along with the "theme forecast." I spend a lot of time on it each week. It helps to prepare your game plan for the week ahead, and it is not as easy as you might think.
This Week's Theme
The market has been rather forgiving about some weaker economic data. This has been especially true of the jobs situation, where the rate of growth has seemingly changed.
There are several important employment themes.
- Has the growth rate slowed? How much might be attributed to the weather? This will be a main theme in the week ahead.
-
What about the end of extended unemployment benefits? This topic is mired in competing studies, celebrated by various viewpoints.
- Some see extending benefits as weakening the economy.
- Others see this as a distorted interpretation.
- There is a continuing debate over the North Carolina situation.
- Seasonal and weather effects complicate data interpretation.
- Differing methods, each with some validity, permit political spin potential.
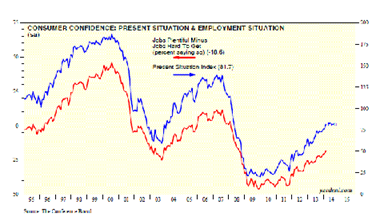
- Ed Yardeni notes that the consumer confidence internals show more confidence about employment.
As always, I have some thoughts that I will share in the conclusion. First, let us do our regular update of the last week's news and data. Readers, especially those new to this series, will benefit from reading the background information.
Last Week's Data
Each week I break down events into good and bad. Often there is "ugly" and on rare occasions something really good. My working definition of "good" has two components:
- The news is market-friendly. Our personal policy preferences are not relevant for this test. And especially -- no politics.
- It is better than expectations.
The Good
There was a little good news and some that was "less bad" than expected. Because of this, the tilt seems a little bullish, which I do not really mean. It was a week of "neutral is good." You might disagree with my scoring!
- An interesting array of unusual indicators are positive. Divorce rates? College attendance? These are not what you would expect but all five are quite plausible. (Rick Newman at Yahoo Finance).
- New Deal Democrat cites improving high frequency indicators. Since he is objective and solidly grounded in the data, we should pay attention.
- Consumer confidence held up. I am calling this a positive since declines were expected. There is a nice account by Kathleen Madigan at the WSJ. See also my favorite Doug Short chart.
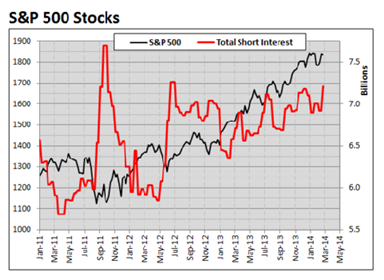
- Short interest is spiking. Ryan Detrick notes that not everyone is bullish. Here is the key chart:
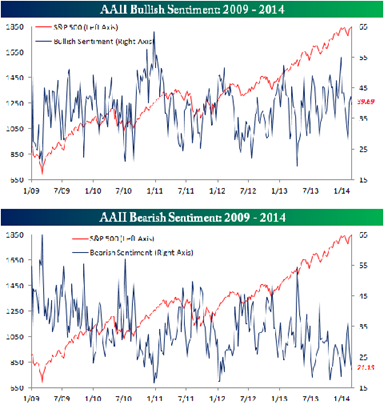
- Sentiment is more bearish a contrarian indicator. Bespoke has the story and their typically great chart.
- Earnings growth is still solid. Brian Gilmartin has (yet another) nice piece where he looks at changes in forward earnings, the Fed model, and the equity risk premium. He discusses 2008 – comparable to current valuations – and notes that there were some different factors involved. His conclusion: "Like the good lawyer once answered, when asked about whether the SP 500 is overvalued or undervalued, "I can argue it either way". CNBC also notes the bullish late-year forecasts.
- Durable goods orders were down, but better than expected given the weather. Doug Short has a nice account.
The Bad
There was also some bad news.
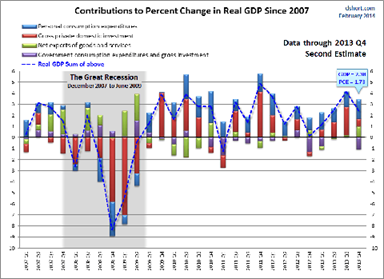
- GDP was revised lower, to an annualized rate of 2.4%. I am scoring this as a negative, despite my last week's warning that this is old news and not very relevant. The below trend growth story continues. The WSJ surveys economists who conclude "nothing new" and even a small positive from inventories. Doug Short's chart helps us to see the component contributions:
- Pending home sales declined 9% over last year. Until the foreclosures are cleared up, this series will challenge us. Here is the Calculated Risk interpretation.
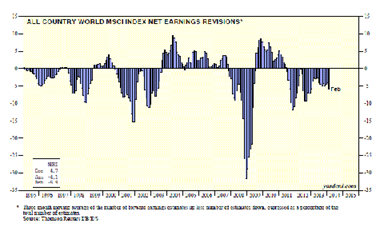
- Global earnings revisions have been negative. Ed Yardeni tracks this and shares a good chart:
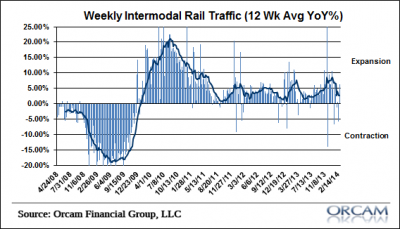
- Rail traffic has been weak. (Cullen Roche).
- Housing data disappointed. The headline numbers were OK, but I am not placing much confidence in the 9.6% increase in new home sales (despite the market reaction). Calculated Risk warns about relying on the headline number. John Lounsbury and Steven Hansen look at the story without the seasonal adjustments – especially difficult to do accurately right now.
- The Ukraine situation remains a big concern. The usual suspects feed a constant stream of commentary and videos. We live in a world of information without context. The events are clearly a market negative, especially in Friday's trading. The "hot money" traders are cautious in front of a weekend. Anything that I write could be obsolete before you read it. There are many good sources for a balanced account of events. I recommend those that are not trying to sell you fear and gold. You can get some good background from the Bloomberg team and with a specific investor orientation from William Watts of MarketWatch. If you are too lazy to read these brief and helpful articles, here is the one-sentence summary: We are very distant from a US/Russia armed conflict. There are umpteen diplomatic steps along the way, starting with skipping a planned trip to Sochi.
The Ugly
Stock trading by SEC employees. Their buying looks like that of the average investor, but sales occur before enforcement actions. That is usually good timing! The SEC responds that the trades were approved in advance by their ethics office, and that employees were required to sell positions when they were working on an enforcement action. (The Washington Post has good coverage of this story).
This is an explanation? That your job not only permits but requires trades based upon inside information? The monitoring program has apparently only been in effect since 2009.
SEC employees should not have investments in individual stocks. How can we otherwise maintain public confidence?
Ukraine. Of course. There is breaking news as I write this. It is an important human story and another chapter in the changing nature of governments around the world. I know that some want to make any conflict into a market story. We can be sympathetic without politicizing our investments. There does seem to be some market reaction to developments, but that should not be our main theme.
The Silver Bullet
I occasionally give the Silver Bullet award to someone who takes up an unpopular or thankless cause, doing the real work to demonstrate the facts. Think of The Lone Ranger. Reader nominations are always appreciated!
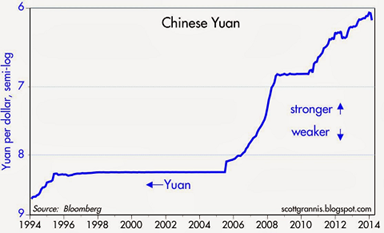
This week's award goes to Scott Grannis, who refutes the scary headlines from the usual suspects. They say that the Chinese currency is "plunging" and shows the biggest single weekly loss ever. People seem to love reading this stuff, since they have made these sources the most popular. We love to have our biases confirmed!
Here is the needed perspective:
Quant Corner
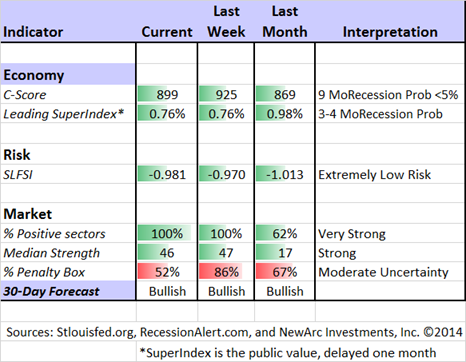
Whether a trader or an investor, you need to understand risk. I monitor many quantitative reports and highlight the best methods in this weekly update. For more information on each source, check here.
Recent Expert Commentary on Recession Odds and Market Trends
Georg Vrba: Updates his newest recession indicator, maintaining an increase in the "weeks to recession" from 26 to 27. This does not mean that there will be a recession in 27 weeks. Instead, it shows that the chance is "statistically remote" that a recession would start during that time. For those interested in gold, Georg also sees a possible buy signal next month. Stay tuned!
RecessionAlert: Sees improvement in leading indicators for US growth, while highlighting danger areas worth monitoring. See the article for detailed charts on each indicator.
Doug Short: An update of the regular ECRI analysis with a good history, commentary, detailed analysis and charts. If you are still listening to the ECRI, you should be reading this update. Doug also has updated the big four indicators important to the NBER in recession dating. Everything except employment is showing a decline – small so far. This is the single best summary of concurrent indicators, so join me in watching it closely. His work is consistent with the most recent ECRI update.
Scott Grannis also has an update of the Bloomberg Financial Conditions Index. I prefer the choices in my weekly table, but there is usually solid confirmation from sources like this.
The Week Ahead
This is a very big week for data.
The "A List" includes the following:
- Employment report (F). More important than ever and difficult to interpret.
- ISM index (M). Important concurrent indicator includes some leading components.
- Personal income and spending (M). Can consumers keep spending?
- Initial jobless claims (Th). Not linked to the Friday report, but still important.
- Fed beige book (W). Anecdotal information, but important color for the next FOMC decision.
The "B List" includes:
- ISM services (W). Growing in significance
- ADP employment report (W). A different method from the BLS and probably just as good. Widely misunderstood.
- Auto sales (W). February data of great interest? Weather effects?
- PCE prices (M). The Fed's preferred measure.
- Trade balance (F). Relevant for Q1 GDP.
- Construction spending (M). January data, but an important economic component.
There will be plenty of FedSpeak, especially on Thursday. Until some stability is reached, the Ukraine news will compete for attention with the economic data.
How to Use the Weekly Data Updates
In the WTWA series I try to share what I am thinking as I prepare for the coming week. I write each post as if I were speaking directly to one of my clients. Each client is different, so I have five different programs ranging from very conservative bond ladders to very aggressive trading programs. It is not a "one size fits all" approach.
To get the maximum benefit from my updates you need to have a self-assessment of your objectives. Are you most interested in preserving wealth? Or like most of us, do you still need to create wealth? How much risk is right for your temperament and circumstances?
My weekly insights often suggest a different course of action depending upon your objectives and time frames. They also accurately describe what I am doing in the programs I manage.
Insight for Traders
Two weeks ago Felix made a dramatic switch from neutral to bullish adding trading positions throughout the week. That has worked pretty well. We remain fully invested and there are many sectors emerging from the penalty box. It has been a challenging few weeks for traders. Felix does not anticipate market tops and bottoms, but managed to adjust pretty quickly both to the correction and the rebound.
Traders can all learn from my friend, Brett Steenbarger, who has resumed blogging. You can start with "Being Your Own Trading Coach" but there is plenty of great recent content.
Insight for Investors
I review the themes here each week and refresh when needed. For investors, as we would expect, the key ideas may stay on the list longer than the updates for traders. The current "actionable investment advice" is summarized here.
This is still an important time for long-term investors. We all know that market corrections of 15% or so occur regularly without any special provocation. Recent years have been the exception. Over the last several weeks I have emphasized the need to maintain perspective, using market declines to add to positions.
It helps if you have been actively rebalancing your portfolio and trimming winners. Then you have some cash. Some readers have asked me to write more on this topic, so I have placed it on the agenda. For now, let me do a quick summary.
- Review your holdings regularly. (For me, that means at least weekly, but it is my job. Quarterly is probably enough for most people, perhaps with some price alerts). Make sure that your original reasons for the investment are still valid. Revise your fair value and price target estimates.
- Do not fall in love with a position. If hanging on to a disappointing holding, make sure your reasons are sound.
- Sell if your price target is hit.
- Rebalance by trimming if a stock appreciates massively, but remains below the price target.
Each week I highlight some of the best advice I see.
Warren Buffett's annual shareholder letter is always a must-read for investors. We had a few "preview items" last week, but there is plenty more in the full letter. Here are some points I found to be especially helpful:
- Focus on the future productivity of the asset you are considering. If you don't feel comfortable making a rough estimate of the asset's future earnings, just forget it and move on. No one has the ability to evaluate every investment possibility. But omniscience isn't necessary; you only need to understand the actions you undertake.
- If you instead focus on the prospective price change of a contemplated purchase, you are speculating. There is nothing improper about that. I know, however, that I am unable to speculate successfully, and I am skeptical of those who claim sustained success at doing so. Half of all coin-flippers will win their first toss; none of those winners has an expectation of profit if he continues to play the game. And the fact that a given asset has appreciated in the recent past is never a reason to buy it.
- Games are won by players who focus on the playing field – not by those whose eyes are glued to the scoreboard. If you can enjoy Saturdays and Sundays without looking at stock prices, give it a try on weekdays.
And especially…..
- Forming macro opinions or listening to the macro or market predictions of others is a waste of time. Indeed, it is dangerous because it may blur your vision of the facts that are truly important. (When I hear TV commentators glibly opine on what the market will do next, I am reminded of Mickey Mantle's scathing comment: "You don't know how easy this game is until you get into that broadcasting booth.")
Read the full letter here.
The most hated rally continues.
Joe Fahmy writes that People Still Hate The Stock Market. He covers the entire story of top-calling and market valuation. Here is a key quote:
On the retail side, I talk to AT LEAST 2 potential clients every month who refuse to invest in the market because "we are at a top." It's been like this for the past 18 months! The pain from 2008 has left deep-rooted scars in the psychology of individual investors.
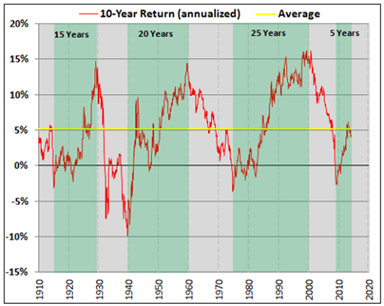
Ryan Detrick has an interesting take on the potential for future market gains – another fifteen years. He is amazed that some are calling this a secular bear market, providing this chart:
Many investors are sitting on cash (Yahoo Finance). This is one of the problems where we can help. Check out our recent recommendations in our new investor resource page -- a starting point for the long-term investor. (Comments and suggestions welcome. I am trying to be helpful and I love and use feedback).
Final Thought
The market continues to show resilience. It is important to understand key economic elements which relate to earnings. Employment is a keystone.
I want to repeat a recommendation from last week. Since my regular report did not go out until Monday (I try, but I cannot always maintain the schedule) it did not have the regular readership. If you read a single thing about employment, this will provide the needed perspective.
Matt Busigin has a first-rate analysis of the employment situation, covering many topics with special insight and better use of data. I have followed employment data carefully for many years and I am not easily impressed. This is really good! He covers plenty of news you can use:
- Household versus payroll surveys – the picture is better than we think
- The reality of labor force participation
- We only need job growth of 67K per month to maintain the current unemployment rate
- How much unemployment is structural
- Could the Fed respond to a tight labor market faster? Much faster…
In addition, I note that Mark Zandi sees the immediate unemployment compensation effects as a reduction of about 0.15% of GDP. There will be more to come as another 1.9 million people lose benefits.
Readers should make their own choices about this as citizens and as voters. In our investment role we must be dispassionate analysts of the economic effects.

