Normally the State of the Union Address would be the focal point for the week's events. In a general sense this is still true, but our focus in this weekly series is much narrower: What will influence markets?
This SOTU speech is unlikely to have a big market effect. The political lines have been drawn. We can all hope for initiatives that will generate some compromise, but I am not hopeful. I expect themes related to the major national problems - -housing and jobs.
My forecast last week was that by Thursday we would all be talking about earnings. I expect earnings to dominate the story this week as well.
I'll take this up further in the conclusion, but first let us do our regular review of the week's news and data.
Background on "The Week Ahead"
There are many good sources for a comprehensive weekly review. My mission is different. I single out what will be most important in the coming week. My theme for the week is what we will be watching on TV and reading in the mainstream media. It is a focus on what I think is important for my trading and client portfolios.
Unlike my other articles I am not trying to develop a focused, logical argument with supporting data on a single theme. I am sharing conclusions. Sometimes these are topics that I have already written about, and others are on my agenda. I am trying to put the news in context.
Readers often disagree with my conclusions. Do not be bashful. Join in and comment about what we should expect in the days ahead. This weekly piece emphasizes my opinions about what is really important and how to put the news in context. I have had great success with my approach, but feel free to disagree. That is what makes a market!
Last Week's Data
In last week's report I observed that there was a change in tone. We saw more of the same this week. In the absence of specific bad news from Europe, the market "wants to move higher." All of a sudden there is more attention paid to specific stock news, and a general upward trend. I'll consider this important development further in the conclusion.
The Good
There was some very good news this week.
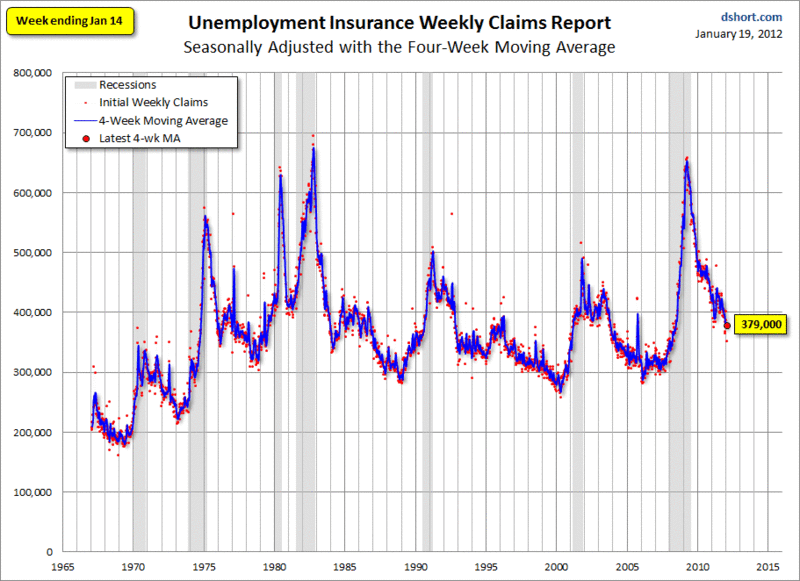
- Initial jobless claim dipped back to the 350K range. See Doug Short for the full story and multiple charts.
- Eurozone news was positive. Auctions went well. The IMF is building up firepower to the $1 trillion range. The one-stop indicator, the Italian 10-year bond, saw yields decline to the 6.2% range from over 7% last week. There is a nice Europe chart pack from Scott Grannis. Here is one example:
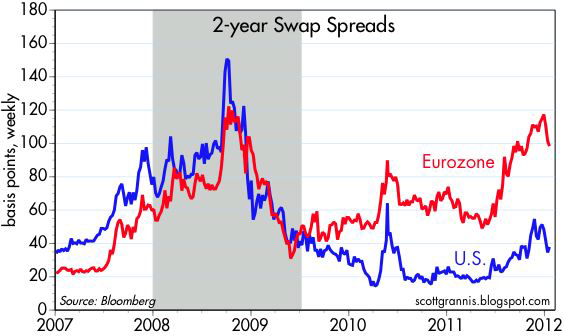
2-yr swap spreads are an excellent indicator of financial market liquidity and systemic risk. Spreads are down meaningfully in the Eurozone, albeit still quite elevated. U.S. spreads are now back to a level that is consistent with "normal" conditions.
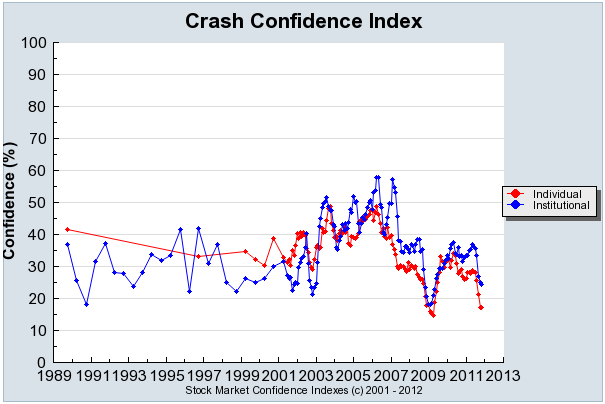
- Most investors have a big fear of a crash. See Bespoke Investment Group's analysis.
- The Fed turned a $77 billion profit last year. Try to find that help from bipartisan deficit negotiators.
The economic data had a few negatives.
- The Baltic Dry Index is plummeting. See Bespoke Investment Group for a great chart. I have paid less attention to this in recent years since the supply factors from shipping outweighed demand.
- Industrial production was a bit light of expectations, although capacity utilization was firm.
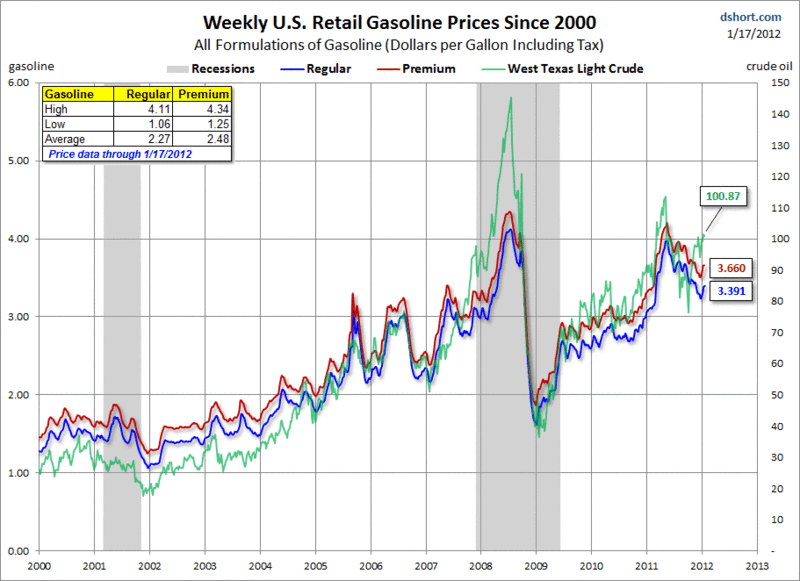
- Gasoline prices continue a steady march higher. Here is the key chart from Doug Short, also supported by AAA. High fuel prices represent a tax on consumption, and one that is difficult to model.
- Building permits were virtually unchanged, month-over-month. The year-over-year change has come entirely from multi-family constructions. Since I am a fan of this series, the housing news bothered me more than most other observers. See Steven Hansen's fine analysis for full details.
I started out to do the "ugly" award for the week, which I initially felt was the fake CNN email about Newt. This was a blatant lie, leveraged through modern methods. Apparently it did not work. Somehow Gingrich has taken stories that would have been devastating in past eras and turned it all to his advantage. As I write this on Saturday night, he is reported as winning the South Carolina primary. If you had merely read the news flow, without seeing the debates, you would never have predicted the outcome.
For starters, as a former practicing political scientist at a big-time school, I see what is happening this year as a real game-changer. The growth of Internet communications and social media is having a dramatic effect. Just think about the differences between 2008 and now -- Facebook, Twitter, and IM versus email -- and we are just getting started. What was innovative in 2008 is now passe'.
One factor is that Gingrich was helped by a debate format that played to his strengths -- plenty of cheering from the audience, and a group receptive to his anti-media pitch. For perspective, I offer some relevant historical notes.
The Picture that Changed History
In 1988 Colorado Senator Gary Hart was the early leader to challenge VP George Bush. His credentials and charisma were excellent. There were rumors......and he challenged the media.
The name of the boat where this was taken was "Monkey Business" as illustrated on the T-Shirt. In 1988 this was a big deal for voters. Hart was crushed in the New Hampshire primary. Dukakis went on to victory for the Dems, and put up a weak fight.
I offer no moral judgment -- just an observation that things have changed to a much higher level of tolerance for many voters.
The New Standard for Dirty Tricks
There is a long tradition of dirty tricks in politics. Any readers who have not heard about Dick Tuck might enjoy reading about his (alleged) exploits. There is something roguish and crafty about putting on a conductor's hat and waving a train out of the station when an opposing candidate is still speaking from the rear platform. Hiring an elderly woman, having her put on a Nixon badge, and setting up an encounter seems clever. The woman, the day after one of the Kennedy/Nixon debates, the first in history, embraces Nixon and comforts him in front of the cameras -- "Don't worry about last night. You'll get him next time."
Watergate took the Dick Tuck moves to a new level. Last week's forged CNN email propagating lies about Gingrich should be disturbing to all of us. I am not going to repeat the lie here, but Gingrich has put out the warning.
And I say this without regard to party or candidate.
Using Political Information
Abnormal Returns had a great post this week on how to use political information to your investment advantage (including an actionable theme). Do not get involved with your emotions or what you think should happen. Stick to forecasting what is likely to happen, and finding the right stocks.
That is exactly what we try to do with political commentary. Take your own opinion to the voting booth. Argue it vigorously with friends. When it comes to investing, think about what will happen, not what you want to happen.
The Indicator Snapshot
It is important to keep the current news in perspective. My weekly snapshot includes the most important summary indicators:
- Economic/Recession Indicators. This week continues two new measures for our table. The C-Score is a weekly interpretation of the best recession indicator I found, Bob Dieli's "aggregate spread." I'll explain the link to the C-Score next week. The second is the Super Index. You can read more about it in this article, which is merely an introduction. It reflects extensive research and testing, and is well worth monitoring. (The Super Index includes the ECRI approach). I am going to do a complete review of the work very soon. Meanwhile, I think it is important enough to watch every week.
- The St. Louis Financial Stress Index.
- The key measures from our "Felix" ETF model.
The SLFSI reports with a one-week lag. This means that the reported values do not include last week's market action. The SLFSI has moved a lot lower, and is now out of the trigger range of my pre-determined risk alarm. This is an excellent tool for managing risk objectively, and it has suggested the need for more caution. Before implementing this indicator our team did extensive research, discovering a "warning range" that deserves respect. We identified a reading of 1.1 or higher as a place to consider reducing positions.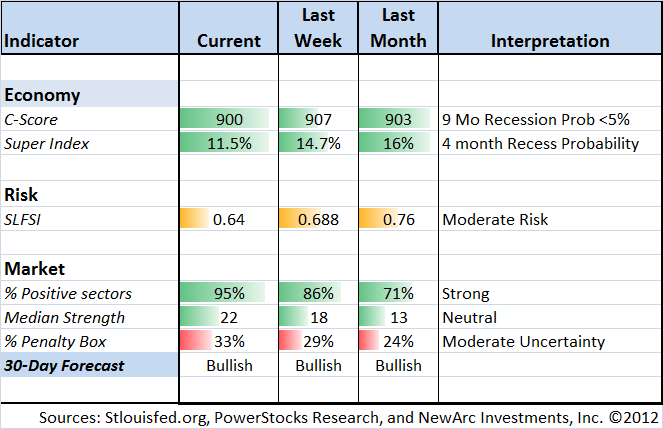
Our "Felix" model is the basis for our "official" vote in the weekly Ticker Sense Blogger Sentiment Poll. We have a long public record for these positions. We voted "Bullish" this week.
[For more on the penalty box see this article. For more on the system ratings, you can write to etf at newarc dot com for our free report package or to be added to the (free) weekly ETF email list. You can also write personally to me with questions or comments, and I'll do my best to answer.]
The Week Ahead
There will be important earnings reports all week. Eventually that is what matters.
Tuesday night we will watch the President. In any other year the new initiatives would be worth considering. In this election year, the proposals will all be suspect.
The FOMC announces a rate decision with a press conference by Chairman Bernanke. Everyone already knows the rate decision. The fresh news will be more insight into the forecasts of the various FOMC members. Anyone following past minutes and transcripts knows that these vary significantly from staff estimates. It could be interesting. Everyone will view this through the prism of whether there will be another round of QE. Market participants are more pessimistic than the Fed on the economy and have a simple heuristic about quantitative easing. It could be interesting.
The week also includes the regular report on initial jobless claims and the initial report on Q411 GDP. The Conference Board will give us their latest take on leading indicators, now including (yet another) change in their definitions, and a redefinition of the entire data series. (yawn).
Oh -- Europe --- at some point we will hear about the negotiations concering Greek debt.
In the midst of all of the news, I think that earnings will be the continuing focus:
- Margin pressure?
- European effect?
- Outlook?
That is what I will be watching. For the comprehensive daily calendar of everything relevant --economic reports, earnings, speeches -- check out Mark Gongloff's helpful list.
Trading Time Frame
Our trading accounts have been 100% invested for several weeks. Felix caught the recent rally quite well and still has several strong sectors in the buy range. While the overall ratings are still not strong, it remains a marginally bullish forecast. This program has a three-week time horizon for initial purchases, but we run the model every day and change positions when indicated. Felix has been more confident than I have been on the trading time frame. This illustrates the importance of watching objective indicators.
Investor Time Frame
Long-term investors should continue to watch the SLFSI. Even for those of us who see many attractive stocks, it is important to pay attention to risk. In early October we reduced position sizes because of the elevated SLFSI. The index has now pulled back out of our "trigger range," but it is still high, but declining. For investors desiring this risk management approach we raised cash when the trigger hit the range. We have also been cautious with new accounts. The improvement here is pretty obvious, and we are getting close to a point where we will be more aggressive. I would like to see a final verdict on the current Greek negotiations. This is not some idea that it represents an "ultimate solution." My basic thesis on Europe -- many plans, many participants, gradual progress, compromise all around -- is playing out. Greece is the immediate issue.
Our Dynamic Asset Allocation model is also very conservative, featuring bonds and other defensive holdings. It is rather like the Nouriel Roubini of our methods. What if things go wrong? Investors should understand that cautious, hedge-oriented positions may be slow to rebound.
To summarize, we continue a conservative posture in most of our programs, recognizing the uncertainty and volatility. For new accounts we are establishing partial positions, using volatility to buy favored names and selling calls for those in the Enhanced Yield program. This program has been working very well, meeting the objectives of conservative, yield-oriented investors. It follows our key precept:
Take what the market is giving you.
Right now that continues to be dividend stocks at reasonable prices with the chance to sell call options at inflated prices. If the stocks do nothing, you can still get almost 10% per year from dividends and call premiums.
This does not work for those selling long-dated calls. It requires some active management, selling calls with a month or two before expiration to capture the most rapid time decay.
The Final Word
This is an important time of decision for many investors.
Quietly -- almost without notice -- things are getting better.
The biggest example is Europe.
Regular readers know that I am a big fan of Charles Kirk, whose work helps traders and investors alike. I always look at his weekly chart show to get the technical picture. I cannot always cite it in this report since I try to write it on Saturday and he posts on Sunday. Charles has a small membership fee that basically goes to cover costs - -he doesn't need it. Investors will recover the cost on the first decision they make.
Members get a daily update including a quote of the day. These are always great (the one about golf was the funniest this week), but today's was especially thought-provoking:
"A market that slowly grinds higher is
a good buy. A market that soars is
usually a good sell." - Neal Weintraub
How much better could things be? Here is an interesting contrast to the 100% recession forecasters from Ed Yardeni:
"The US economy may be on the verge of a big comeback. It could experience an unusual second recovery over the next three years following the weak initial recovery of the past three years. In the past, recessions were followed by one broad-based recovery in economic activity. The Naysayers have been predicting a “double dip” recession for the US economy since it started to recover in 2009. I’m suggesting that a more likely scenario might be a double back-to-back recovery."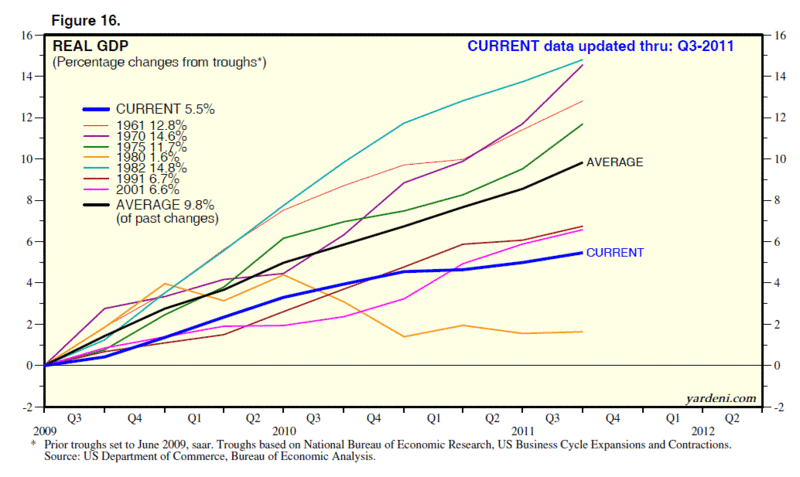
and finally, his conclusion....
"In the past, recessions were followed by one, not two recoveries. This time, key sectors of the economy haven’t participated in the initial economic rebound, but finally may be on the verge of doing so. The second recovery could take off as the pace of hiring quickens, housing activity finally picks up, auto sales head higher, and state and local governments stop retrenching. If so, then the US would finally enjoy the benefits of a broader-based recovery."
This is an interesting concept but we need an alliterative term to equal "double dip." For those of us who see investing as a zero sum game with a lot of misguided and misinformed players, this is something to think about. Even noted doomster Marc Faber thinks that you should consider stocks!
