First, thanks to all of those readers who took time to respond to the poll attached to yesterday’s comment. The early results are interesting, but the polls are still open! Please take a minute to respond, if you have not already done so.
Data over the last two days has been pretty discouraging. ADP yesterday printed the lowest reading since September, giving credence to the theory that a mild winter contributed to the sense of recovery. I think there’s something to that theory, but I also think there was some actual recovery. The truth is that the economy was improving, but it wasn’t improving as fast as it seemed to.
Today’s data reinforced that sense, as the ISM non-manufacturing index declined to the lowest level since December. The 53.5 reading was a surprise on the low side, but still in expansion territory. Again, there’s some weak growth there but not as much as the weather made it seem. Initial Claims (365k versus expectations for 379k) was a bright ray of sunshine, but ‘Claims have still not improved since January or February and are likely still running around 370-380k on average.
One economic release you don’t generally hear much about is the ICSC Chain Store Sales (ex-Walmart) figure. You don’t hear much about it because it is pretty volatile as the chart below (Source: Bloomberg) shows.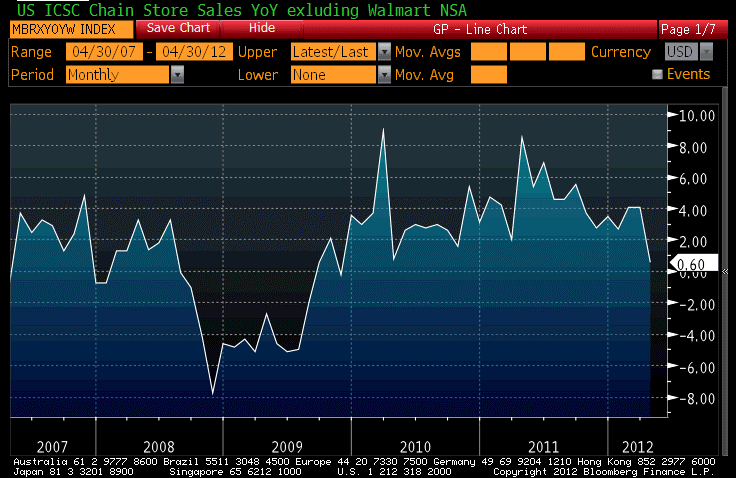
As the chart also shows, today’s y/y figure was the weakest since 2009. Now, with this much volatility in the series we can’t reject the hypothesis that the real underlying rate is about what it was before; but in the context of broadly softening data it does seem to echo the storyline.
The storyline will likely get a further echo tomorrow, with the release of Nonfarm Payrolls for April (Consensus: 160k vs 120k, Unemployment Rate 8.2% – unchanged). The consensus seems high, but most markets also seem to be bracing for somewhat bad news (except, as always, the equity market). While stocks closed lower today by -0.8%, it was just Tuesday when the talking heads were applauding a new high in the Dow. But nominal interest rates are at the lowest level since February (1.93% in the 10y), and real interest rates are essentially at the lowest levels ever.
Worst, though, are commodities, which have been getting burned since late April…of 2011. If you want to find a market where the bad news is already heavily discounted, it is in the commodity indices. The chart below (Source: Bloomberg) shows Non-farm Payrolls (in red), Initial Claims (inverted, in yellow), and the DJ-UBS commodity index (in white). You can see that while commodities generally moved up with the initial improvement in the economy, since May of last year they have been weakening despite stable-to-improving metrics of job growth.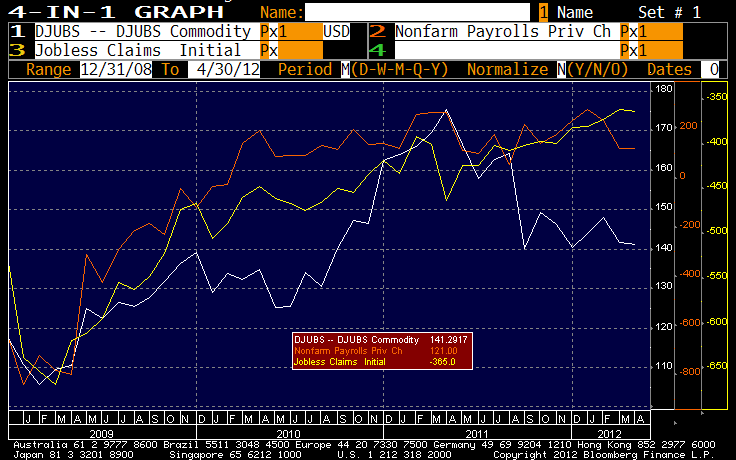
Of course, it also goes without saying that the decline in commodities over the last year also stands in contrast to the rise in core inflation from 1.3% last April to 2.3% now.
In short, commodities never got the benefit of the QE3 hype that helped keep other markets frothy, and didn’t get the benefit of continued recovery over the last year (see for example the chart below, source Bloomberg, showing the recent wide gulf in performance that has opened up between stocks (in yellow) and commodities (in white) after a long period of high correlation). I’ve recently mentioned that according to our metrics, commodity indices are at rarely-exceeded levels of cheapness. So it doesn’t seem quite fair that the sentiment against commodities is so negative.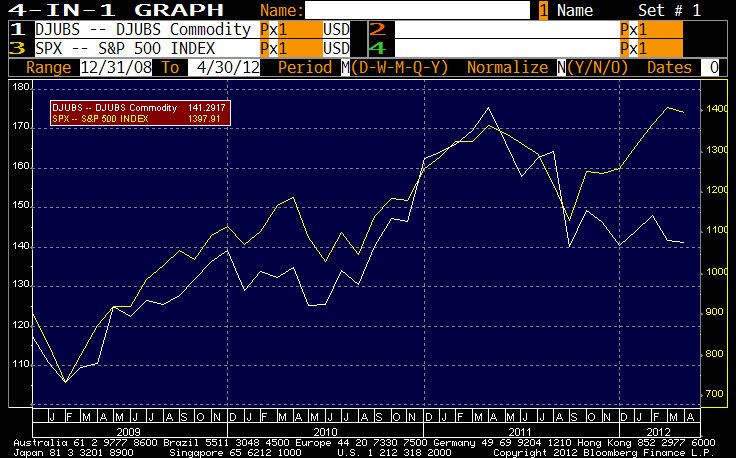
Not that markets need to be fair, of course! But I think many investors just don’t understand the appeal of commodity indices. Even fairly experienced investors like Warren Buffett have made clear that they don’t care for commodities. To be fair, Buffett and others were generally talking about the owning of individual commodities, like Berkshire’s ill-fated holding of huge amounts of silver early in the last decade, and which don’t have a natural source of non-zero real return, while I am generally speaking of commodity indices, which do have ample sources of real return. One of those sources of return, and one that is seriously underappreciated, is rebalancing.
The reason that rebalancing adds returns is that rebalancing to neutral weights is a systematic method by which you are selling what goes up and buying what goes down. That’s one way to buy low and sell high! In order to have significant returns to a rebalancing strategy, however, several things need to be true: the assets need to have reasonably high volatility as well as a low correlation between them. If all of the assets are moving together, there is obviously no important benefit from switching between them.
I did an experiment recently to illustrate how rebalancing can affect one’s returns. The chart below (Source: Enduring Investments) shows a total return index for two strategies involving a portfolio of four assets: Crude oil, Copper, Coffee, and Sugar. This is obviously a fairly diverse group of commodities. One strategy produces just the price return from the front futures contract (I didn’t adjust for the rolls; the absolute return isn’t important, only the relative return of one strategy versus the other), assuming an initial investment of 25% in each asset and no rebalancing. That produces the red line. If the portfolio is rebalanced monthly, then we get the result shown in blue. Rebalancing produced a return of about 3.5% per year in this case.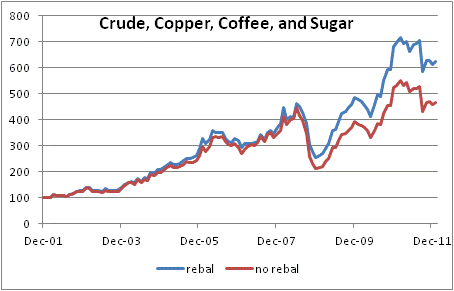
By contrast, the next chart (Source: Enduring Investments) shows an analogous experiment with four equity indices: the MSCI EAFE index, the S&P Developed Property Index, the Russell 2000 Value Index, and the Russell 2000 Growth Index. The rebalancing return here is worth a mere 0.23% per year.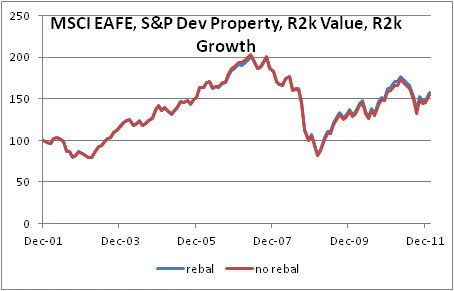
Now, if you have a portfolio of individual equities, rather than indices, then you have a better chance of realizing some rebalancing return. However, even in that case it is important to realize that most of an equity’s return is a market return: that is, in a bull market almost all stocks rise and in a bear market almost all stocks fall.
None of this will tell you anything about tomorrow’s return, but for the rebalancing return and the relative value I continue to prefer commodity indices, and our models are tilted heavily in that direction (partly because of the paucity of alternatives). Honestly, as long as our investors remain patient we believe that taking the long view is the right way to wring profits from these markets.
Speaking of patient, we will see this weekend whether French citizens are inclined to further patience with Sarkozy or if they feel it is time to change horses. Polls indicate a close race but with Hollande the likely victor; although this is the expected outcome there may be some market volatility associated with that result. On the other hand, if Sarkozy wins, it is likely Euro-positive and I would expect equity and bond markets in Europe to rally. Personally, I don’t think it makes much difference who wins, because the Euro’s fate is being determined by imbalances far larger than voting blocs.
- English (UK)
- English (India)
- English (Canada)
- English (Australia)
- English (South Africa)
- English (Philippines)
- English (Nigeria)
- Deutsch
- Español (España)
- Español (México)
- Français
- Italiano
- Nederlands
- Português (Portugal)
- Polski
- Português (Brasil)
- Русский
- Türkçe
- العربية
- Ελληνικά
- Svenska
- Suomi
- עברית
- 日本語
- 한국어
- 简体中文
- 繁體中文
- Bahasa Indonesia
- Bahasa Melayu
- ไทย
- Tiếng Việt
- हिंदी
The Value Of Balance
Latest comments
Loading next article…
Install Our App
Risk Disclosure: Trading in financial instruments and/or cryptocurrencies involves high risks including the risk of losing some, or all, of your investment amount, and may not be suitable for all investors. Prices of cryptocurrencies are extremely volatile and may be affected by external factors such as financial, regulatory or political events. Trading on margin increases the financial risks.
Before deciding to trade in financial instrument or cryptocurrencies you should be fully informed of the risks and costs associated with trading the financial markets, carefully consider your investment objectives, level of experience, and risk appetite, and seek professional advice where needed.
Fusion Media would like to remind you that the data contained in this website is not necessarily real-time nor accurate. The data and prices on the website are not necessarily provided by any market or exchange, but may be provided by market makers, and so prices may not be accurate and may differ from the actual price at any given market, meaning prices are indicative and not appropriate for trading purposes. Fusion Media and any provider of the data contained in this website will not accept liability for any loss or damage as a result of your trading, or your reliance on the information contained within this website.
It is prohibited to use, store, reproduce, display, modify, transmit or distribute the data contained in this website without the explicit prior written permission of Fusion Media and/or the data provider. All intellectual property rights are reserved by the providers and/or the exchange providing the data contained in this website.
Fusion Media may be compensated by the advertisers that appear on the website, based on your interaction with the advertisements or advertisers.
© 2007-2025 - Fusion Media Limited. All Rights Reserved.
