
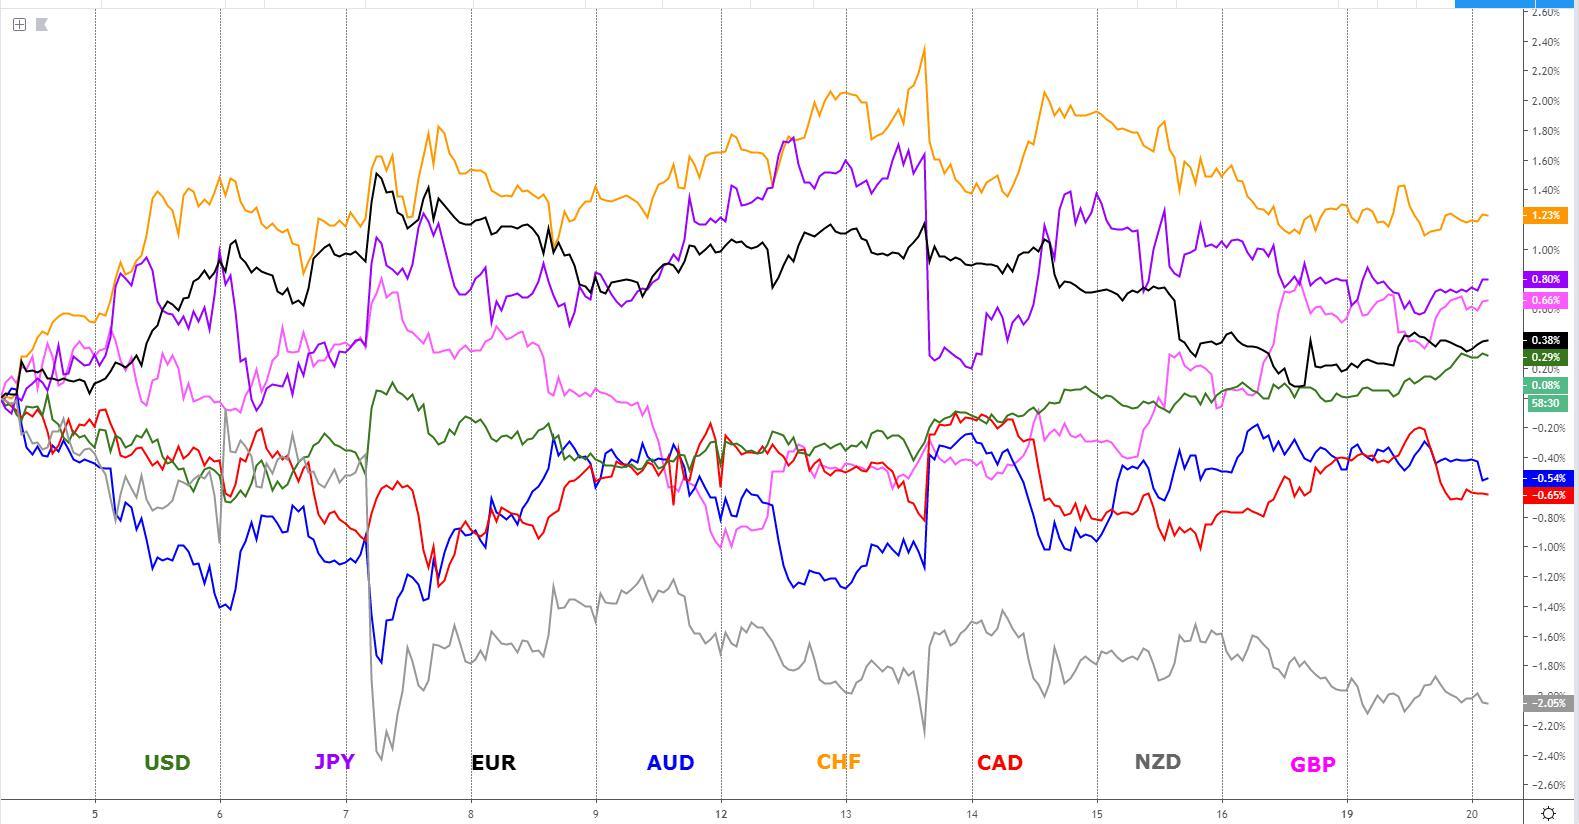
The equally-weighted currency strength model reinforces the notion that the USD remains the currency drawing the most buying interest as depicted by the decisive breakout of its resistance level. This resolution sets into motion the prospects of further upside momentum.
Quick Take
The US dollar continues to attract the most buy-side flows in the Forex market as the thematic of 'no alternatives' to put one's capital to work in the currency space makes, by default, the world's reserve currency still the best destination to obtain a bit of a yield rolling in. The dominance is clearly reflected by the breakout of a key resistance in the prop US Dollar index (equally-weighted vs G8 FX) that we follow here at Global Prime. The fact that a slightly less hawkish Fed's Rosengren made no difference to dethrone the victorious parade of the USD speaks volume of the bullish sentiment at play. By the same token, the commodity currencies (AUD, NZD, CAD) saw opposite dynamics, with an improved risk tone in equities and bonds not sufficient to attract buying flows, which is a clear troubling signal going forward. The Euro held steady as evidence mounts that Germany readies a stimulus plan for its ailing economy coupled with renewed hopes that Italy may form a new government after all. The Sterling had an uneventful day. Last but not least, the Yen and the Swissy have traded quietly despite the rebound in risk, which by itself should be a fairly positive sign, as it tells us the interest by the large capital to de-risk its protection by diversifying away from the favorite safe haven vehicles remains quite low, which should read as the uncertainty still at too elevated levels.
Narratives In Financial Markets
* The Information is gathered after scanning top publications including the FT, WSJ, Reuters, Bloomberg, ForexLive, Institutional Bank Research reports.
Risk tone gets better: The risk mood in equities and fixed income kept improving in a low key affair day predominated by light news flows. Nonetheless, the bid tone in risk found another anchor after reports emerged to confirm that the US will delay Huawei ban by 90 days. However, the decision is far from being a game-changer to bridge the major gap in distrust between the two countries, but it does show that the US keeps making small gestures of bonafide to steer back on track trade negotiations, even if in the last few weeks since Trump broke the truce, a lot of damage was done, and the proof is in the pudding by China letting the Yuan weaken to stay competitive. According to US Commerce Secretary Wilbur Ross, the delay extension will allow US companies “a little more time to wean themselves off” their reliance on Huawei.
Expectations build-up for a cut in Chinese corporate borrowing: The positive mood in stocks took a positive lead from Asia by reports that China is set to base new lending benchmark on medium-term rates as part of its key interest rate reforms. The decision has led to the chatter of an imminent slash in corporate borrowing costs to support businesses under the cosh due to the ailing economic activity as the year-long trade war goes on.
A new government in Italy? The Euro has been trading firmer with one supporting factor including the rising expectations of a potential new government being formed in Italy, led by PD (The Democratic Party) and 5-Star. Reports in the Italian media fueled these expectations by noting that Italy's PD has had 'good' informal talks with 5-Star on the formation of a new government, which are now waiting for Italy’s PM Conte to offer his resignation to the President before formal talks get underway.
Fed's Rosengren a tad less hawkish: The appearance of Fed’s Boston President Rosengren in a Bloomberg interview commanded the focus of the market, as he was one of the dissents not to ease in the last July FOMC. Even if on aggregate, his comments felt not as hawkish as one would expect, the price action in the US Dollar is yet more evidence that the current sentiment in the currency is strongly bullish. Some of the key take takeaways included Rosengren saying that “we have to be careful not to ease too much when we don't have significant problems,'' adding that “I'm not saying there aren't circumstances where I'm willing to ease, I just want to see evidence that we are actually going into something that's more of a slowdown." Rosengren also reiterated that the Fed is supposed to focus on unemployment and inflation in the US.
Trump says the Fed should cut by 100 bps and resume QE:
“Our Economy is very strong, despite the horrendous lack of vision by Jay Powell and the Fed, but the Democrats are trying to "will" the Economy to be bad for purposes of the 2020 Election. Very Selfish! Our dollar is so strong that it is sadly hurting other parts of the world. The Fed Rate, over a fairly short period of time, should be reduced by at least 100 basis points, with perhaps some quantitative easing as well. If that happened, our Economy would be even better, and the World Economy would be greatly and quickly enhanced-good for everyone!”
Germany readies stimulus package: There continues to be more evidence, via a Bloomberg report, citing two people with direct knowledge of the matter, that Germany is working on a stimulus plan as part of the contingency measures designed to deal with a recession in the country, aimed at propping up the economy to generate more consumer spending and avoid large-scale job losses. A sharp economic downturn is a scenario the German Central Bank has outlined as a clear risk in reports this week. The news that Germany is readying more fiscal spending to stimulate the economy is congruent with comments over the weekend by the German finance minister, Olaf Scholz.
Jackson Hole Symposium key risk event: The key event this week comes on Friday at 14:00 GMT, when Fed Chair Powell is scheduled to speak at the Jackson Hole Economic Policy Symposium in a speech titled "Challenges for Monetary Policy". It’s likely to be a major market mover as the market will have an opportunity to re-adjust its outlook towards the Fed’s Sept policy decision. Before the event, though, the meeting minutes from the last FOMC meeting will be released on Wednesday at 18:00 GMT, which may also hold sufficient relevance to see market positioning altered as the market is in high alert and hypersensitive to gain new insights on the next policy move by the Fed now that an easing mode is finally underway. For now, there is a 100% chance for a 25bp rate cut, while a 50 bps rate cut is considered to be a scenario with ⅓ chances at present.
Recent Economic Indicators & Events Ahead
Other key events this week include the RBA monetary policy meeting minutes this Tuesday, the Canadian CPI and the US FOMC meeting minutes on Wednesday, a bunch of Eurozone PMIs on Thursday, including Germany, France and the EU flash manufacturing/service PMI, while also the US flash manufacturing PMI, with the New Zealand and Canadian retail sales on Friday, alongside the mentioned Jackson Hole economic policy symposium (runs for 3 days).
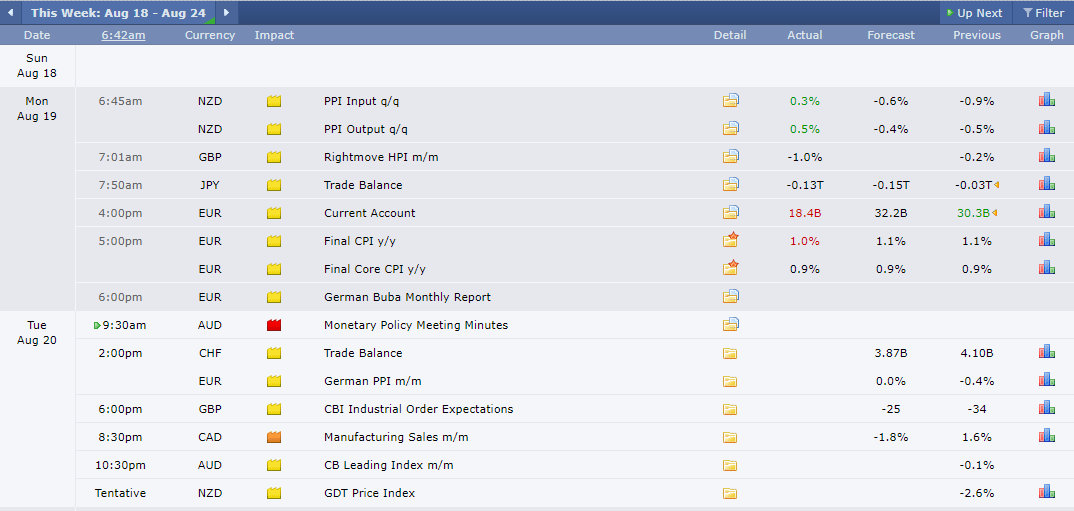
Source: Forexfactory
A Dive Into The Charts
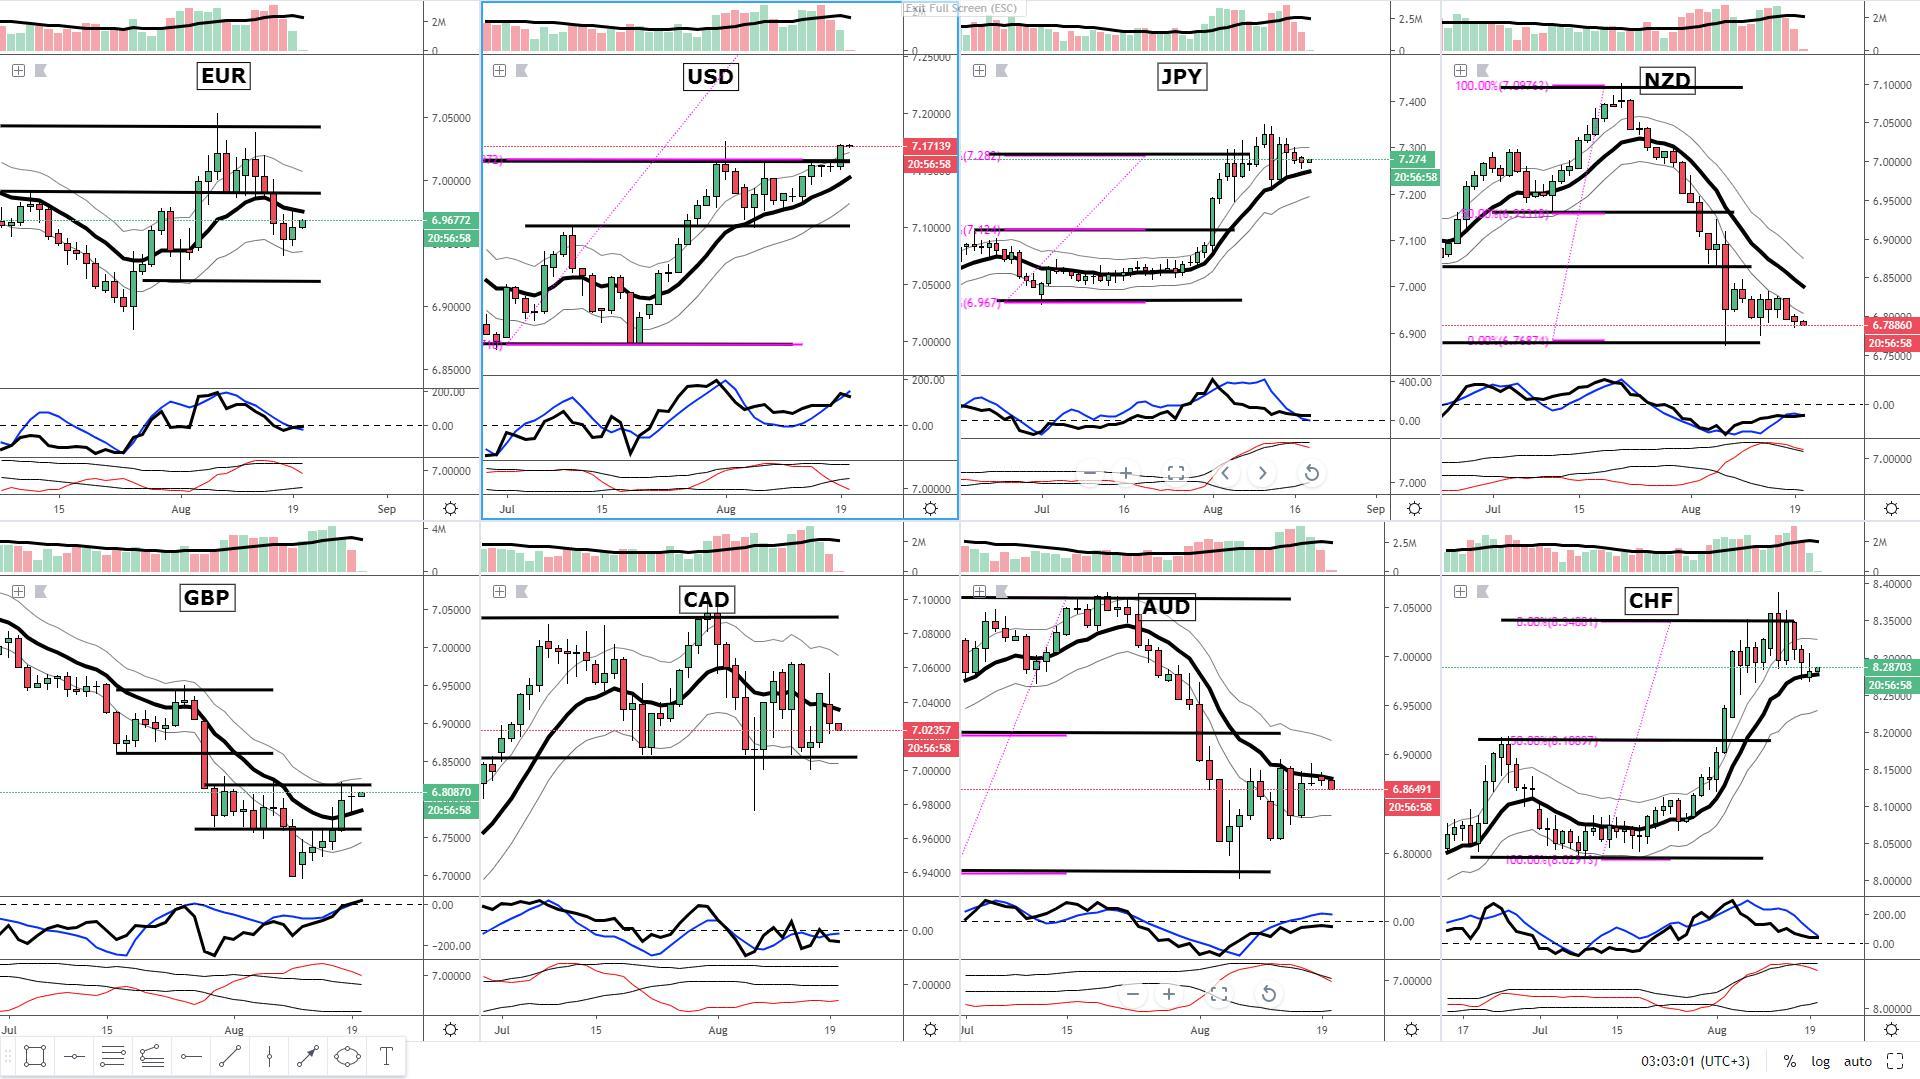
The equally-weighted currency strength model reinforces the notion that the USD remains the currency drawing the most buying interest as depicted by the decisive breakout of its resistance level. This resolution sets into motion the prospects of further upside momentum as the week unfolds. As a caveat, the technical breakout came on low tick volume, so I wouldn’t be surprised at all to see a retracement in the index as the move is probably going to run out of juice. The Euro index has attracted bids in the last 24h but still in a bearish context as the baseline caps the upside. The Sterling index continues to struggle at the key resistance outlined earlier this week, even if one must recognize that the outlook in the currency has improved after 6 days of consecutive rises. The CAD remains in a ‘yo-yo’ mode, with the latest flows taking the index back into bearish territory. The Yen and Swissy have so far found bids re-emerging at the baseline, which keeps the overall outlook still position even if evidence of a trend resumption is not yet given as both remain offered. It’s worth noting that even as the risk tone gets better, the retracement in the Yen index has come on a sequence of tapering volume in the last 3 candles printed, which is not a convincing sign for a continuation of lower levels. The same picture applies to the Swissy. Lastly, the oceanic complex shows a poor performance with market participants not buying the currencies with any impetus at all even if the shift in risk dynamics would argue otherwise. Again, a bad sign.
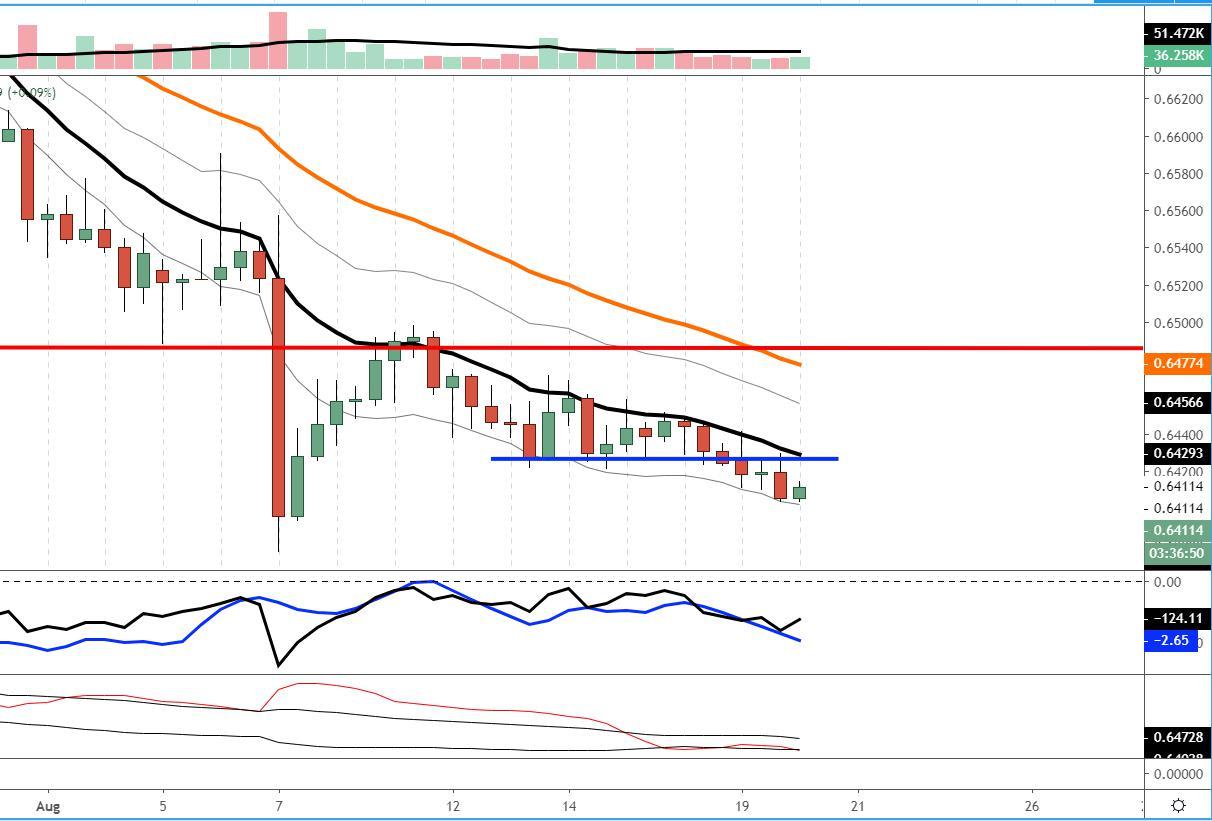
To start off, as I elaborated in yesterday’s note, the NZD/USD still looks fragile for an eventual retest of its post-RBNZ 50bp rate cut shocker low around the 0.6395/0.64 mark. I am basing my view off the 8h chart this time, looking to exploit the resolution of the 0.6925 breakout from last Friday. All my personal pre-qualifiers were met, including a slight uptick in volume as the break occurred. Besides, the currency indices model clearly shows the match up of a strong vs weak market.
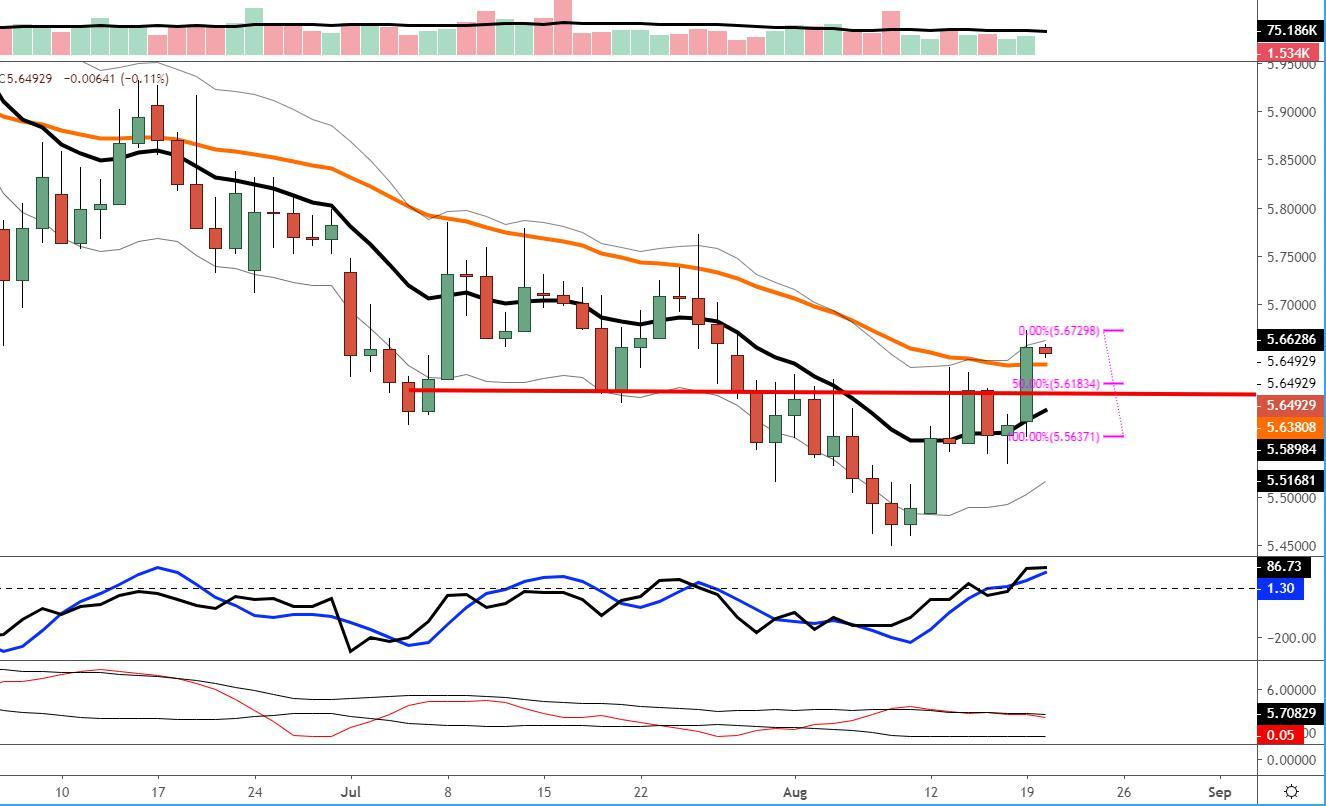
The second market where I see the potential for traders to bank on the USD strength is against the Turkish lira, with the latest price action showing a break above a key resistance a validation of this prognosis. The rest of the qualifiers I pay attention to such as market structure, the baseline left behind, tick volume picking up are all checked as are my main indicators. Since the close by NY is borderline to the ATR limit I utilize to manage my risk, an entry at a 50% retracement makes more sense to me here.
Important Footnotes
- Risk model: The fact that financial markets have become so intertwined and dynamic makes it essential to stay constantly in tune with market conditions and adapt to new environments. This prop model will assist you to gauge the context that you are trading so that you can significantly reduce the downside risks. To understand the principles applied in the assessment of this model, refer to the tutorial How to Unpack Risk Sentiment Profiles
- Cycles: Markets evolve in cycles followed by a period of distribution and/or accumulation. To understand the principles applied in the assessment of cycles, refer to the tutorial How To Read Market Structures In Forex
- POC: It refers to the point of control. It represents the areas of most interest by trading volume and should act as walls of bids/offers that may result in price reversals. The volume profile analysis tracks trading activity over a specified time period at specified price levels. The study reveals the constant evolution of the market auction process. If you wish to find out more about the importance of the POC, refer to the tutorial How to Read Volume Profile Structures
- Tick Volume: Price updates activity provides great insights into the actual buy or sell-side commitment to be engaged in a specific directional movement. Studiesvalidate that price updates (tick volume) are highly correlated to actual traded volume, with the correlation being very high, when looking at hourly data. If you wish to find out more about the importance tick volume, refer to the tutorial on Why Is Tick Volume Important To Monitor?
- Horizontal Support/Resistance: Unlike levels of dynamic support or resistance or more subjective measurements such as fibonacci retracements, pivot points, trendlines, or other forms of reactive areas, the horizontal lines of support and resistance are universal concepts used by the majority of market participants. It, therefore, makes the areas the most widely followed and relevant to monitor. The Ultimate Guide To Identify Areas Of High Interest In Any Market
- Trendlines: Besides the horizontal lines, trendlines are helpful as a visual representation of the trend. The trendlines are drawn respecting a series of rules that determine the validation of a new cycle being created. Therefore, these trendline drawn in the chart hinge to a certain interpretation of market structures.
- Correlations: Each forex pair has a series of highly correlated assets to assess valuations. This type of study is called inter-market analysis and it involves scoping out anomalies in the ever-evolving global interconnectivity between equities, bonds, currencies, and commodities. If you would like to understand more about this concept, refer to the tutorial How Divergence In Correlated Assets Can Help You Add An Edge.
- Fundamentals: It’s important to highlight that the daily market outlook provided in this report is subject to the impact of the fundamental news. Any unexpected news may cause the price to behave erratically in the short term.
- Projection Targets: The usefulness of the 100% projection resides in the symmetry and harmonic relationships of market cycles. By drawing a 100% projection, you can anticipate the area in the chart where some type of pause and potential reversals in price is likely to occur, due to 1. The side in control of the cycle takes profits 2. Counter-trend positions are added by contrarian players 3. These are price points where limit orders are set by market-makers. You can find out more by reading the tutorial on The Magical 100% Fibonacci Projection