Stimulus payments creates a strong platform for growth
To get any meaning out of the February personal income and spending report we need to look at it in combination with January data. The $600 stimulus payment in early January, together with ongoing support from extended and uprated unemployment benefits, lifted incomes by 10.1% MoM.
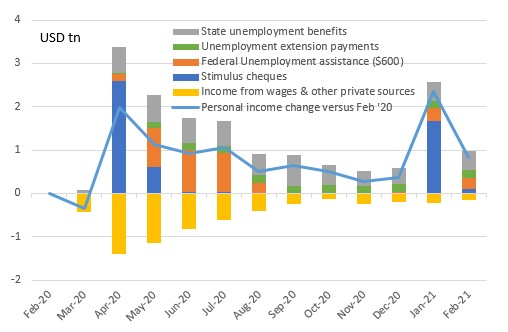
Put another way, as the chart below shows, household incomes were $2.5tn higher on an annualised basis versus February last year. An astonishing figure, that has given Americans the cash flow to not only spend more, as seen with the upwardly revised 3%MoM real spending growth figure for January but to also pay down credit card balances and to save more.
The Federal Reserve’s flow of funds data shows that cash, checking and savings deposits have increased by $3tn since 3Q19. That means as the re-opening gathers momentum there is an incredibly strong platform for consumer spending growth.
The fact that there wasn’t a stimulus payment in February accounts for all of the 7.1% January to February drop in incomes, but again it is important to point out that income levels this February are still $1tn annualised higher than they were last February. With another $1,400 stimulus payment having hit bank accounts in March – nearly $400bn has been paid out by the government - we must be looking for a huge surge in March and April income data.
Incomes have soared through the pandemic
Contributions to the change in household incomes versus Feb 2020 (USDtn)
Source: Macrobond, ING
Spending is surging and will accelerate
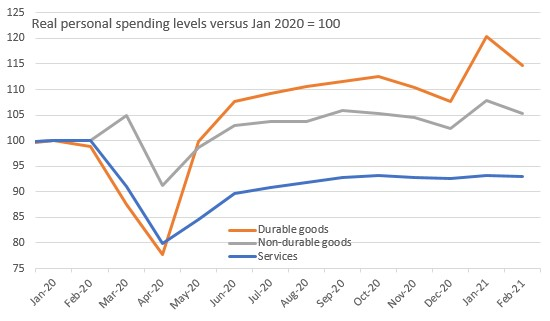
February spending fell 1.2%MoM after that 3% January jump. People may well be getting tired of buying physical things as this is all that we have been able to do over the past year. Bad weather in February could also have influenced the data. However, March and April are likely to post incredibly strong spending figures.
With more and more of the economy re-opening there are more options to spend money. Services, such as restaurants, hotels and travel, are set to benefit hugely based on the daily data we see from TSA airport security check numbers, OpenTable dining data and hotel reservations. Putting it all together we are pencilling in 9% annualised consumer spending growth in Q1 and possibly 15% growth in Q2. The US economy is roaring back.
Services lag goods spending, but that will soon change

Source: Macrobond, ING
Soft inflation, but that will change too
The Fed’s favoured measure of inflation – the core personal consumer expenditure deflator – actually dipped to 1.4%YoY from 1.5%. However, it is the April and May numbers that are going to show the big increases as price levels in a vibrant reopened, supply-constrained economy contrast starkly with those of one in lockdown last year. The Fed will continue to push their very dovish view for the next few months, but we suspect that will be increasingly difficult to reconcile with the data flow we expect to see through 2021.
Original Post
Content Disclaimer: The information in the publication is not an investment recommendation and it is not an investment, legal or tax advice or an offer or solicitation to purchase or sell any financial instrument.
This publication has been prepared by ING solely for information purposes without regard to any particular user's investment objectives, financial situation, or means. Read more
