Bitcoin, the unstoppable train. This is true if we look at the last 11 years of price action. This is also true if we talk about unstoppable code and the fact that bitcoin doesn’t need any regulation because its code is THE LAW! However, in this chart-book, we are specifically referring to recent price advancements. Sine the “corona and Maker Dao flash crash” prices for one bitcoin have rallied from US$3,850 up to US$9,485 posting gains of more than 135% within just six weeks. We have three arguments for strength identification in this case:
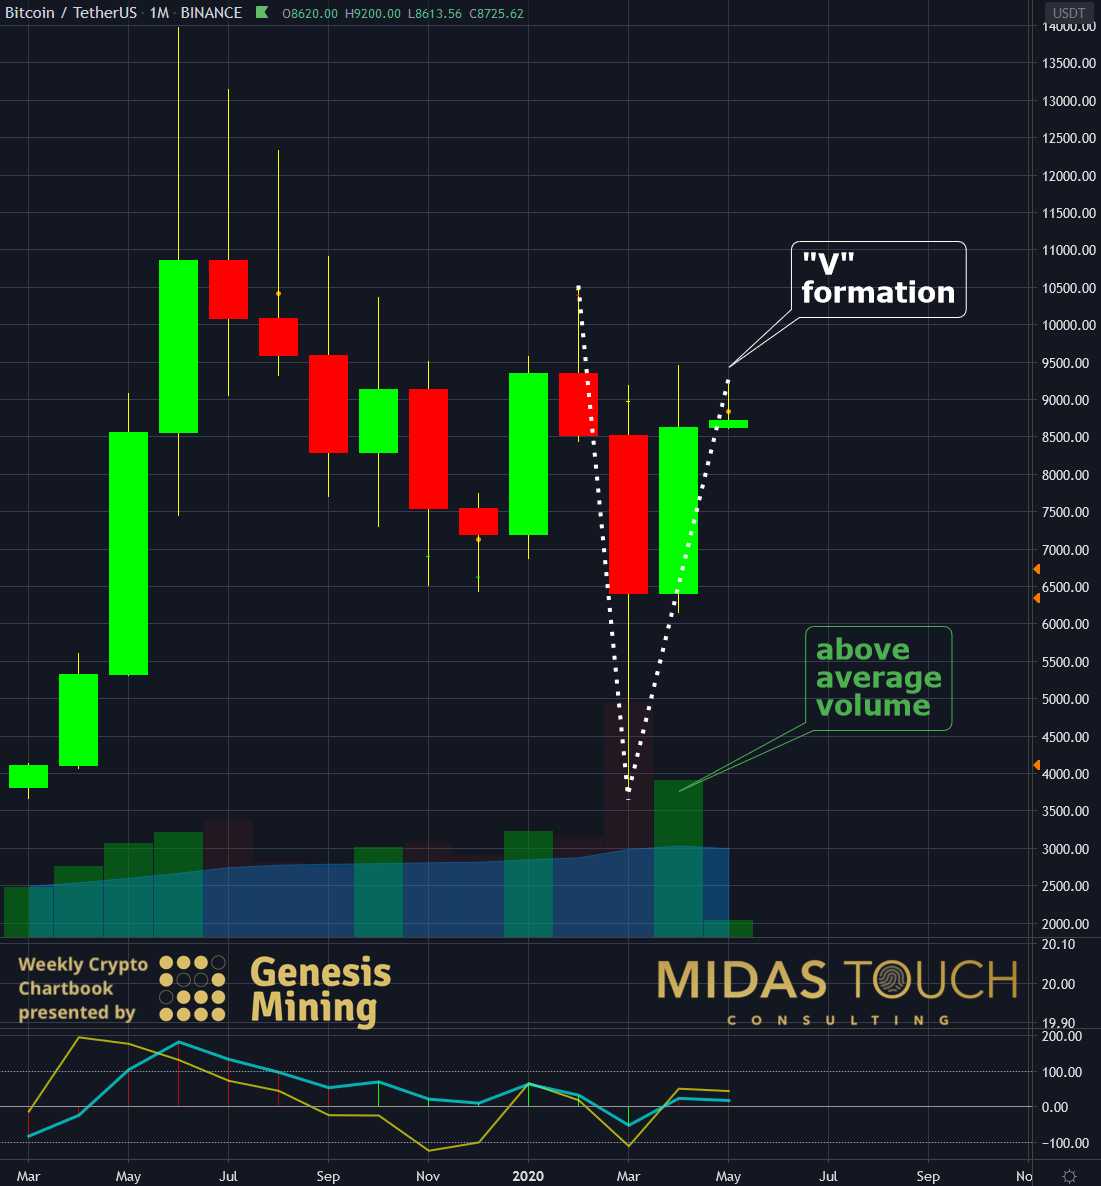
- A “V” formation reversal pattern indicating the possible end of the downtrend
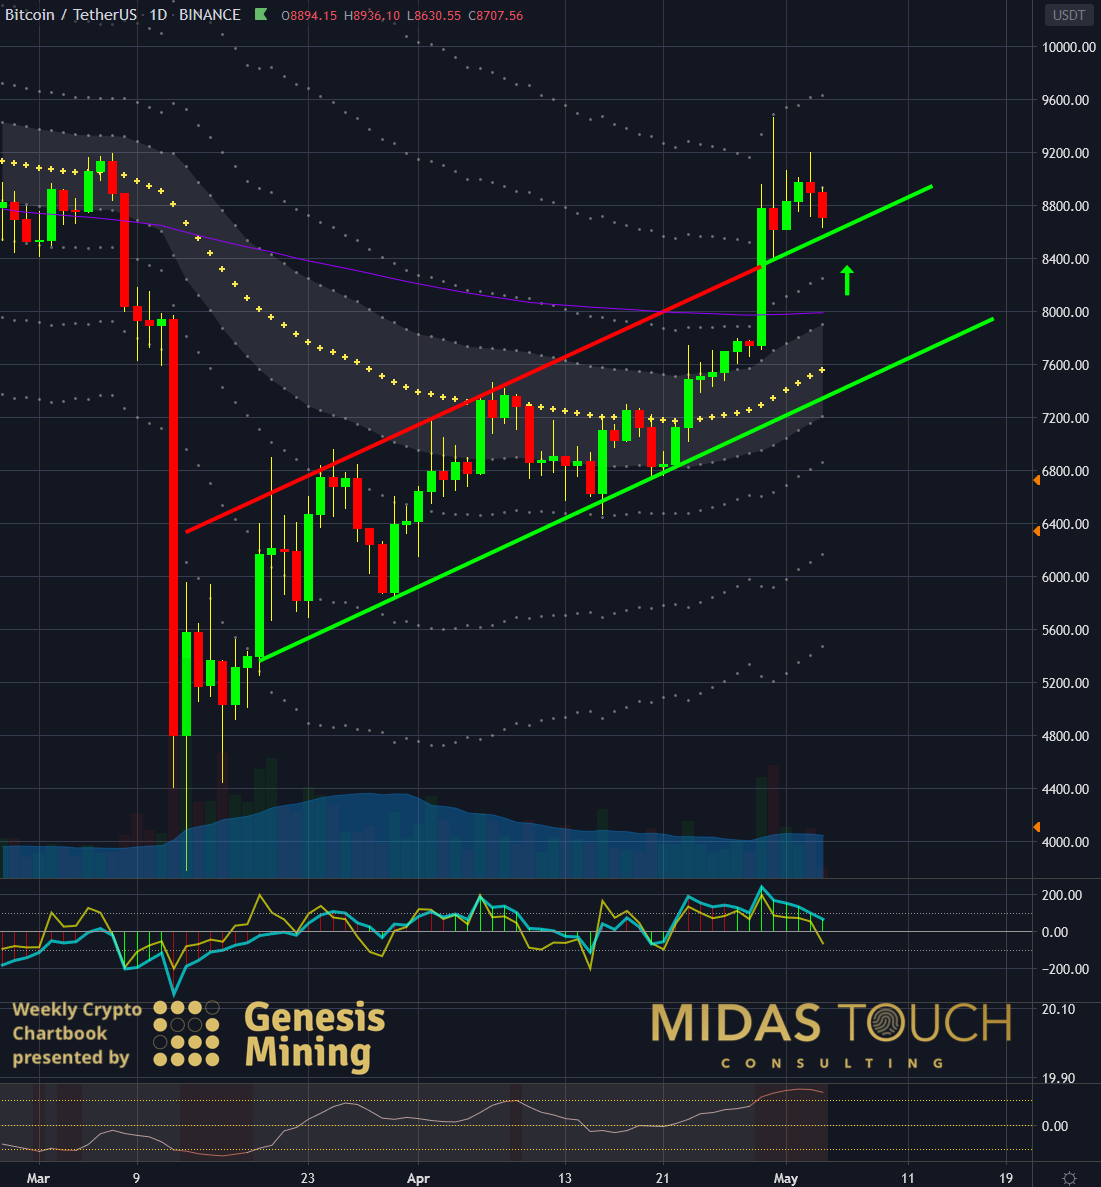
- Newton’s law defining, that an object in motion stays in motion unless acted upon by an unbalanced force (this is basically the underlying principle for all trend followers)
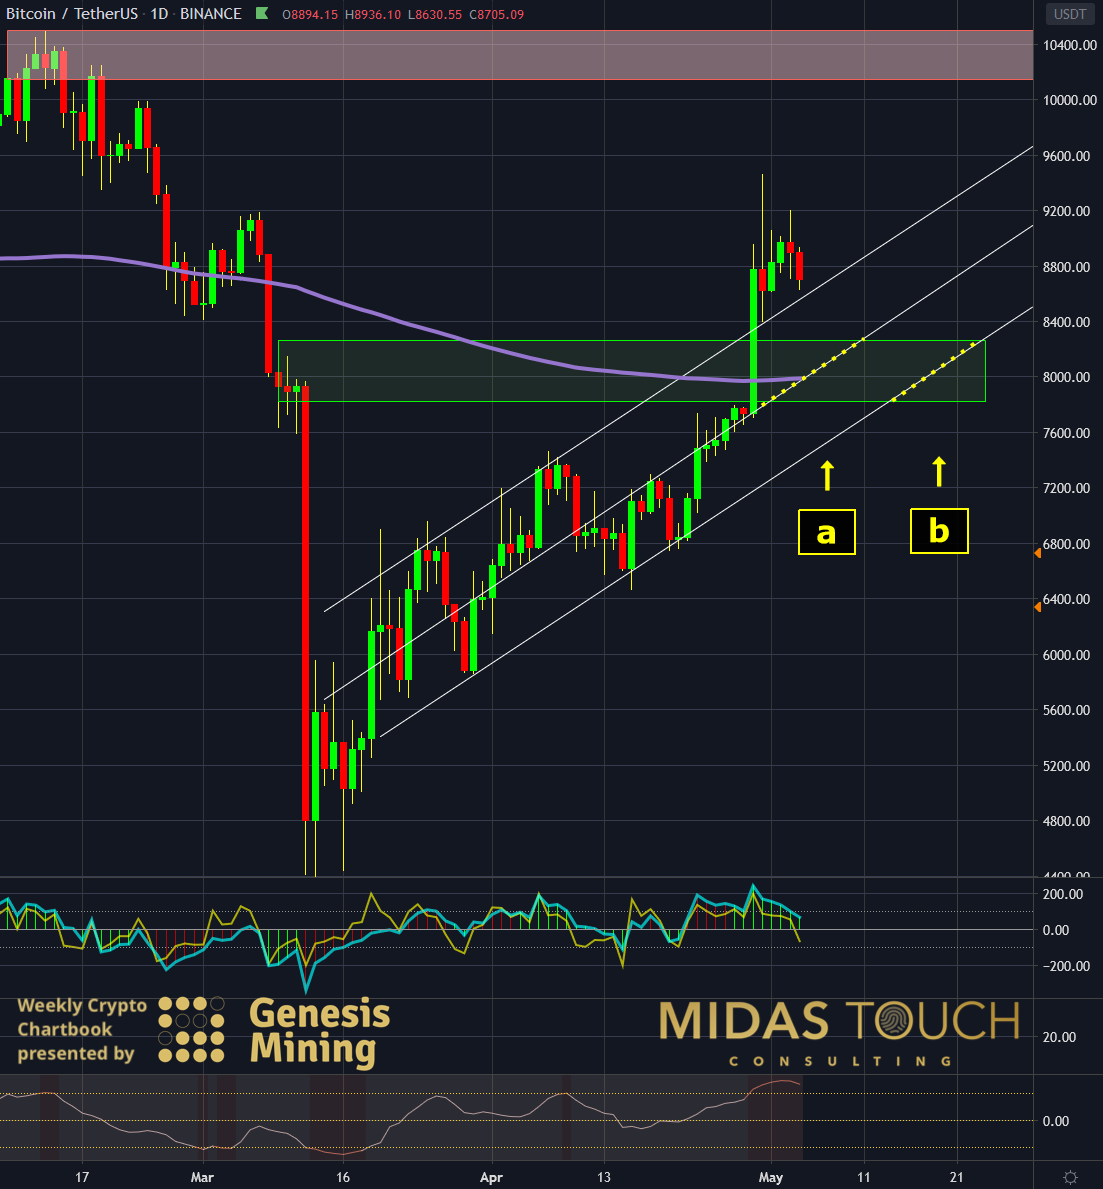
- “Creep up”, describing the way of price movement on smaller time frames in slow but persistent fashion
BTC-USDT, Monthly Chart, “V” Formation:

With a more than 100% bounce from recent lows, we can identify a “V” formation on the monthly chart. From a candlestick perspective, this is called a “bullish engulfing pattern”. In the same vein, this is a definition of a reversal pattern. It is the large time frame sentiment that should guide the trader for the direction of trading.
BTC-USDT, Daily Chart, Newton’s Law Of Motion:

The upward trading channel above shows clearly how prices advanced steadily. Last week the upper channel boundary was violated by price. Emphasizing strength. What was resistance has become support. As such we are looking for a long entry at the upper green directional trend line within the next days.
With Newton’s law on the trader’s side, we are looking for low-risk long entry trade prospects is this week´s task.
BTC-USDT, Daily Chart, “Creep Up” = Trustworthy Support, The Unstoppable Train:

The “creep up” has multiple underlying principles edges. One of them being, that directional trend lines have a stronger support probability than usual. This counts especially for a channel´s mid line. That being said, we would have stacked odds even more if we get a price retracement to the mid or even low channel line. A fractal supply and demand zone in conjunction with the 200-day moving average makes entry zones (a) and (b) very attractive. The yellow dotted line as a price entry zone is key.
The unstoppable train
Reversal patterns typically have a sideways formation following and advance further when numerous attempts by short traders to fade the prior move fail. The typical novice shies away from entries after a 90% bounce. It feels like being late to the party.
When sitting behind the screen and observing a “creep up” it feels like the move ends at any time soon. The professional is aware though that “creep ups” can continue for a very long time.
Taking orientation from higher time frames (e.g. monthly) helps to become clear about which direction to trade.
