The United States became a net oil exporter for the first time in 75 years, or so they say. While the U.S. may indeed be exporting more petroleum than it imports from time to time, there’s a dirty little secret behind the data. And one of those secrets overlooked by some energy analysts and the press is that the U.S. still imports 7 million barrels per day of oil.
So, why would the United States continue to import 7 million barrels per day (mbd) of oil if it is indeed a Net Oil Exporter? Good question. And, the answer to that question is hidden in the details, or as they say, “The devil is in the details.”
According to the EIA, the U.S. Energy Information Agency, the U.S. first became a net oil exporter during the week of Nov 30th, 2018 by exporting 211,000 barrels per day more than it imported. Please understand the figures below also include petroleum products:
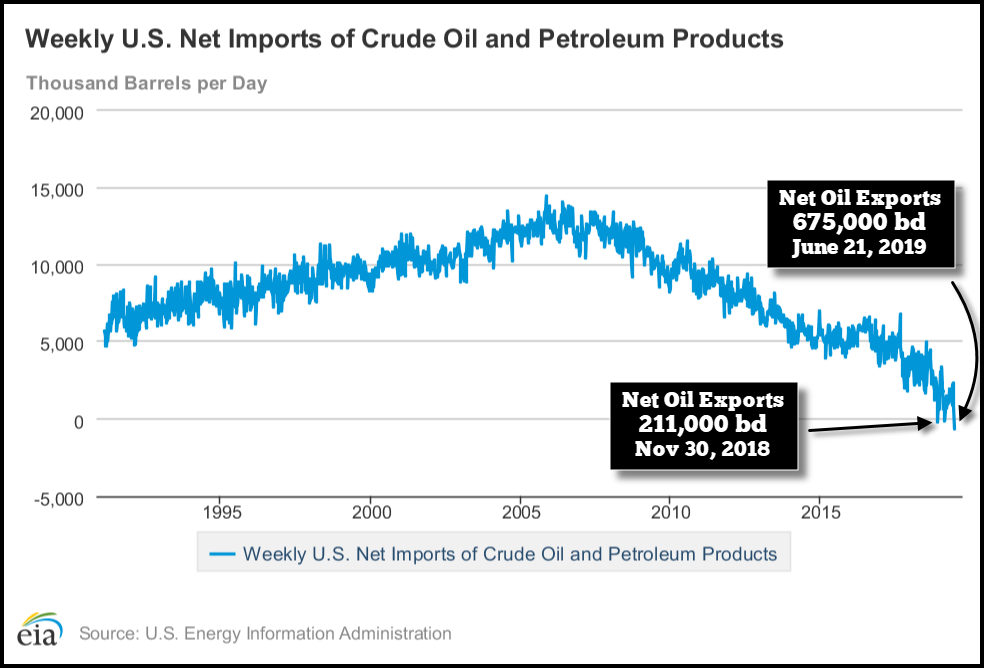
The graph shows the data as negative because it is presented as “net oil imports.” Thus, a negative number means the U.S. is exporting more than it imports. I have changed my figures in the chart to represent “net oil exports.” As we can see, the U.S. had an even higher amount of net oil exports this past week at 675,000 barrels per day. Regardless, the U.S. has been a net exporter for three weeks out of the past seven months. However, if we look into the details of this data, we will find out that the United States isn’t exporting this oil and petroleum because it “WANTS” to, but because it’s “FORCED” to. There’s a big difference.
NOTE: The charts in this article come directly from the U.S. Energy Information Agency website, with my added annotations.
So, where do we begin? Let’s start with the growth of U.S. oil production. While U.S. shale oil production first began to ramp up in 2008, this chart shows the increase in total oil production since 2014:
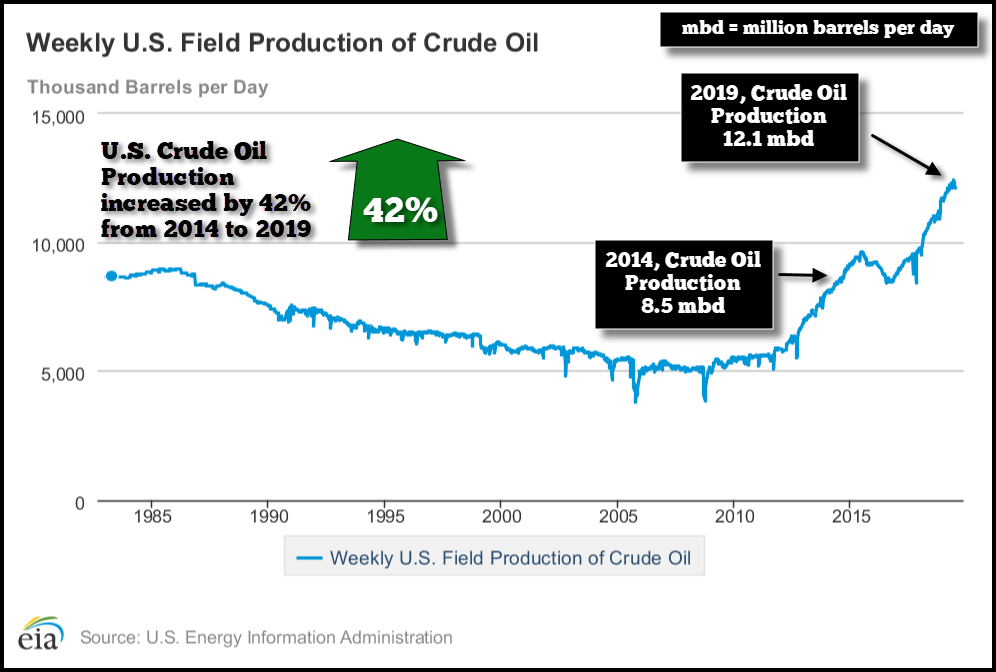
U.S. crude oil production increased by 3.6 million mbd, or 42% in the past five years. The majority of this production increase has attributed to the growth in U.S. shale oil. However, while our domestic oil production has increased significantly, our usage of petroleum in the transportation sector is only up 5% during the same period:
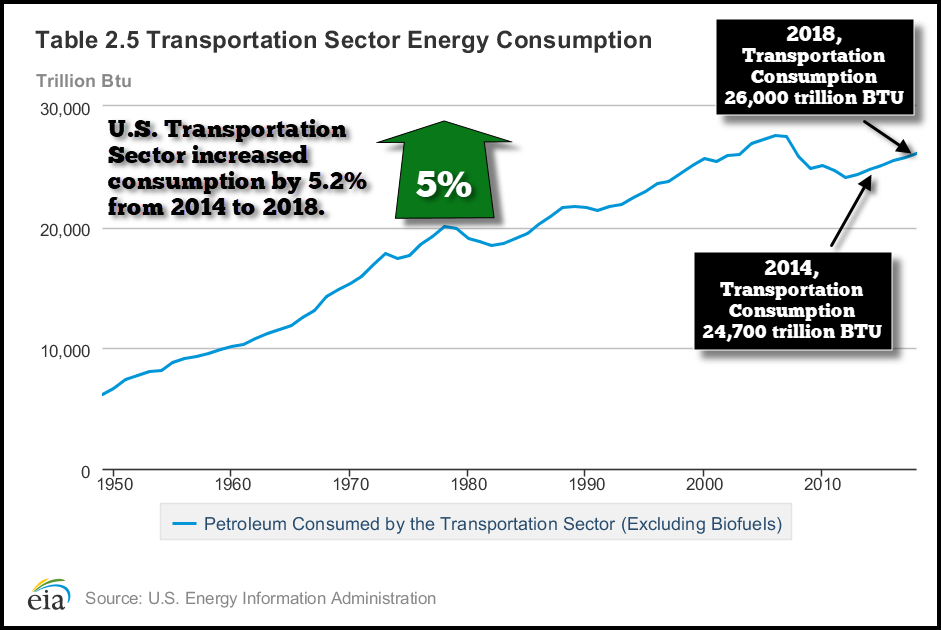
I don’t mean to confuse, but this chart shows the U.S. transportation energy consumption in Trillion BTU’s. From 2014 to 2018, the domestic transportation industry has only increased its energy usage by 5%. I also checked the data for the first three months of 2019, and it hasn’t increased all that much versus the same period last year.
So, if we aren’t consuming much more oil in driving up and down the U.S. Interstate Highways, then it makes sense that we can import less oil as our domestic production has increased… correct? Wrong. If we are producing a great deal more oil than we did in 2014, then why are U.S. crude oil imports nearly the same as they were five years ago?
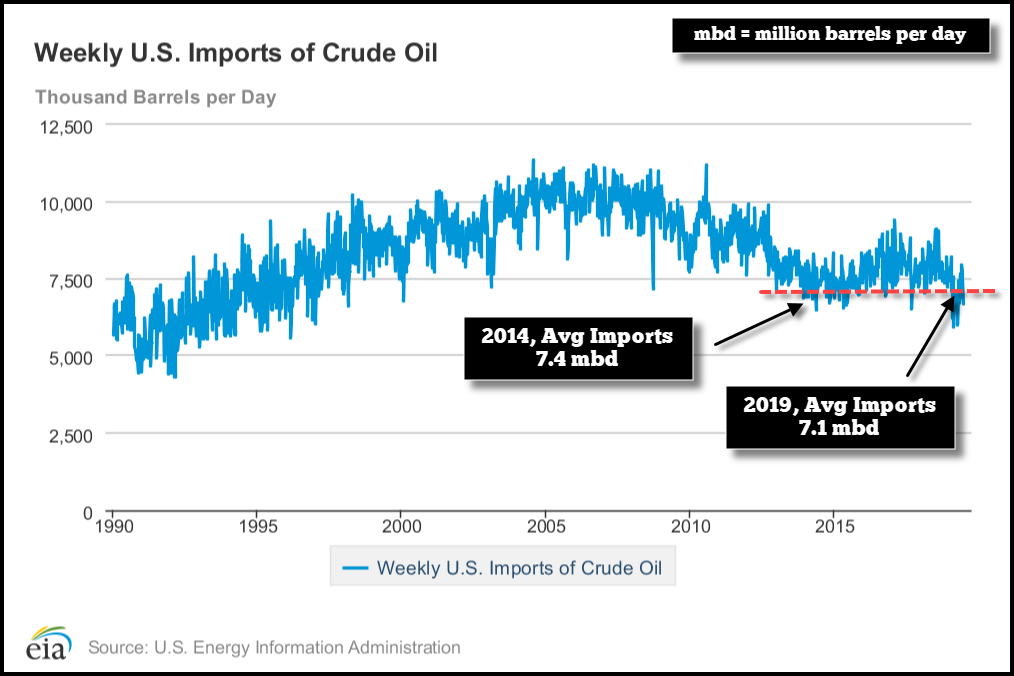
Here we can see that total U.S. crude oil imports currently average 7.1 mbd (2019) versus 7.4 mbd in 2014. If we consider that U.S. oil production has surged by 3.6 mbd since 2014, then why haven’t our crude oil imports DECLINED more significantly? Well, part of the answer can be found in the following chart:
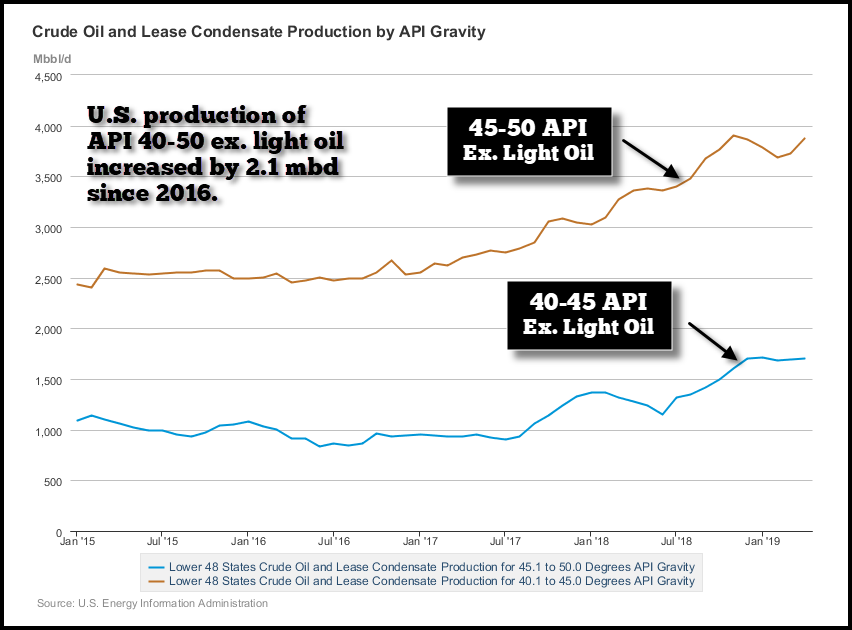
The main increase of U.S. oil production comes from a very light grade of shale oil. Extremely light tight shale oil has an API Gravity rating of 40-50 degrees. And in the past three years, the production of U.S. 40-50 API oil has increased by 2.1 mbd. And where does the majority of this extra light tight shale oil come from? It comes from North Dakota, Texas and New Mexico, via the Bakken, Eagle Ford, and Permian Shale Oil Fields (the chart is shown in thousand barrels per day):
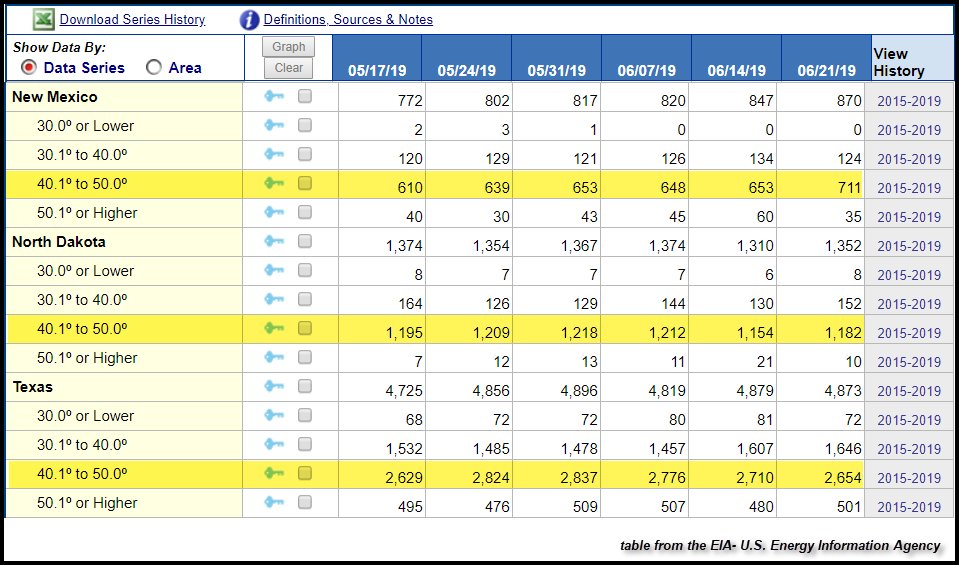
These three states are producing 4.5 mbd of the very light tight shale oil (40-50 API) produced in the United States. To understand the different oil grades, simply put, the lower the API rating, the heavier the oil. Heavy Canadian oil sands have an API rating of 20-25, while medium grade conventional is 30-35 API, and much of the shale oil is very light at 40-50 API. Unfortunately, U.S. refineries are set up for a much lower grade conventional oil of 31-33 API Gravity:
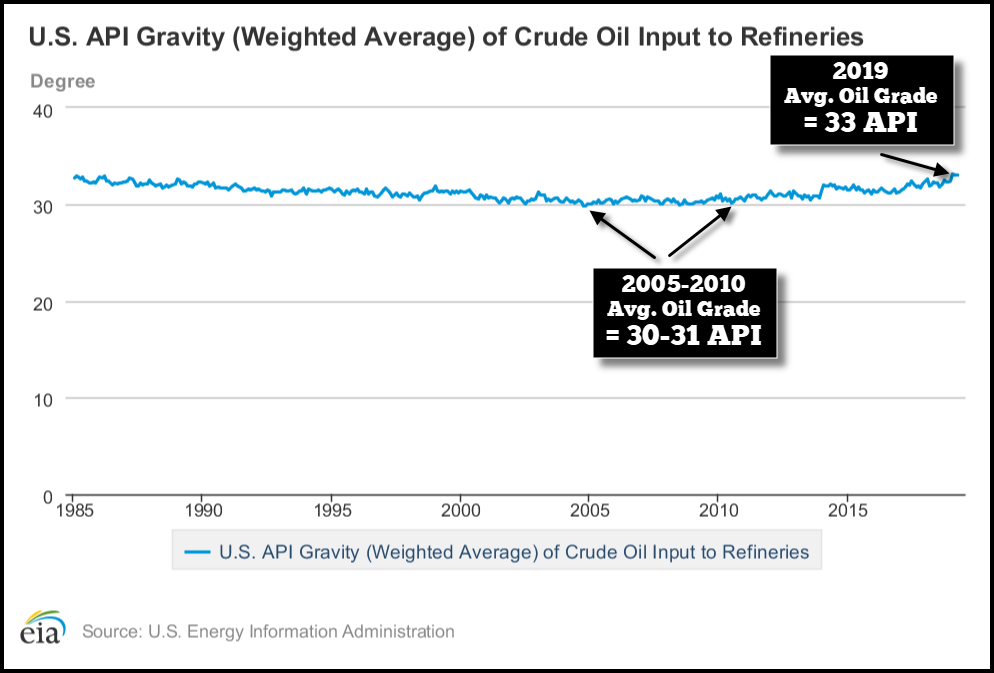
In looking at the chart above, while the average API Gravity of U.S. crude oil inputs to refineries has fluctuated a bit since 1985, it has remained in the low 30’s. Which is precisely why the U.S. House and Senate approved the bill to lift the ban on U.S. oil exports in December 2015:
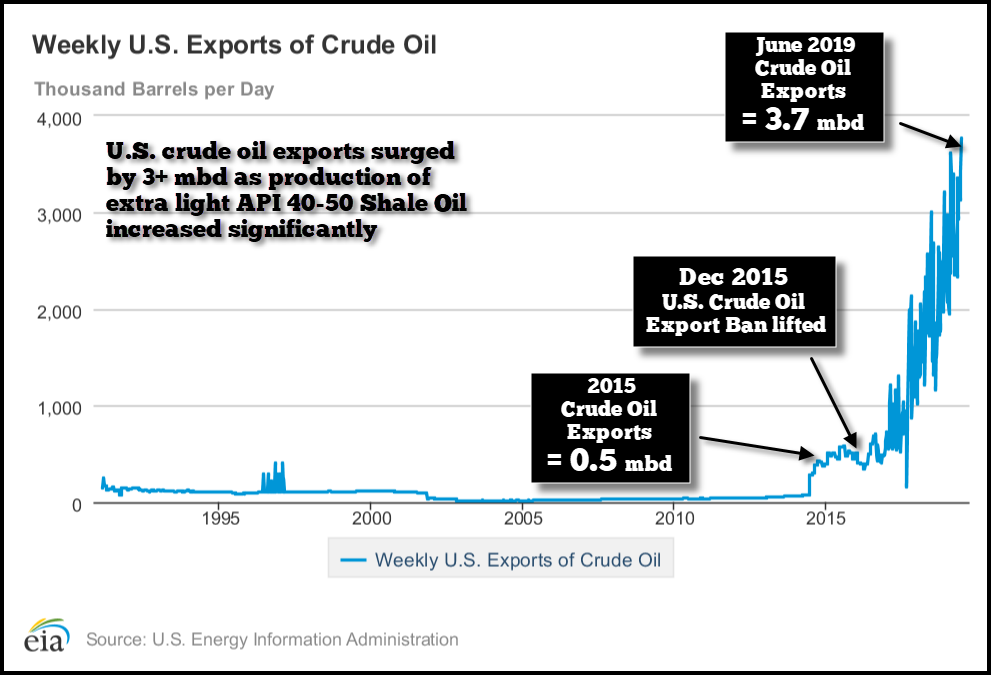
With the rapid surge of shale oil production over the past several years, the U.S. found itself with a glut of extremely light tight oil (40-50 API) that it couldn’t use. Thus, the U.S. government didn’t lift the crude oil export ban because it wanted to become a NET EXPORTER, but rather, because it was desperate to get rid of the type of oil that it had no use for. Here we can see that since the crude oil ban was lifted, the U.S. is now exporting 3.7 mbd of crude oil, up from 0.5 mbd in 2015. Thus, the U.S. is likely exporting nearly half of the shale oil that we are producing.
Now, the 3.7 mbd of crude oil exports do not include “petroleum products.” The U.S. also exported 5.6 mbd of petroleum products this past week, for a total of 9.3 mbd of crude oil and petroleum products. However, 2.7 mbd of that total of petroleum product exports was Propane/Propylene and Other Oils:
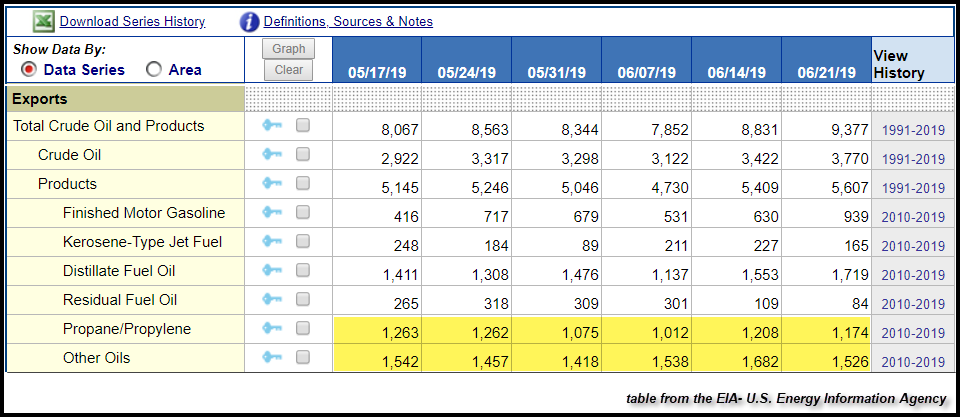
The table above, from the EIA, shows the breakdown in U.S. crude oil and petroleum product exports in thousand barrels per day. The highlighted yellow area shows the amount of Propane/Propylene and Other Oils exported at the bottom of the table. Propane/Propylene are products from Natural Gas Plant Liquids, which the U.S. now produces 4.3 mbd, shown in this chart below from a previous article:
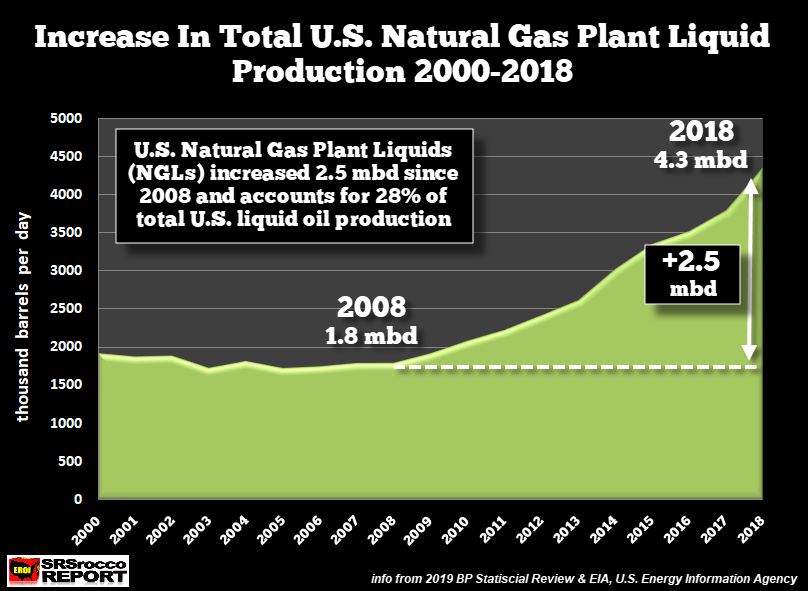
As U.S. shale oil and gas production ramped up, we also saw a huge increase in the Natural Gas Plant Liquid (NGLs) supply. NGLs, a by-product of shale oil and gas production, are also feedstocks for the plastic industry. While I don’t know components of the EIA’s “Other Oils” category, it also increased significantly with the growth of shale oil. Thus, Propane/Propylene & Other Oils exports increased by 2.0 mbd since 2010.
So, if we add the 3.7 mbd of crude oil plus 2.0 mbd of Propane/Propylene & Other Oils exports, it equals 5.7 mbd. Thus, a large percentage of U.S. petroleum exports are from the type of oil and products we can’t use. Of course, all oil-producing nations are also exporting surpluses of oil not needed in their domestic economy, but the difference is, the majority are exporting high-quality conventional medium grade 30-40 API oil.
Much of the very light tight shale oil is sold at a discount to conventional oil, and a barrel of NGLs can be 50+% less. Furthermore, because U.S. shale oil is so light, it is sold more as a blending petroleum stock, combined with lower API gravity oil, such as oil sands from Canada to form more of a medium grade oil.
And, that is precisely the very reason why we continue to import 7 mbd of oil. As shown above, U.S. refineries are designed for a conventional medium grade oil with a much lower API than light tight shale oil at 40-50 API. So, it’s no surprise that as U.S. shale oil production increased, so has the amount of heavier grade Canadian oil sands imports (20-25 API):
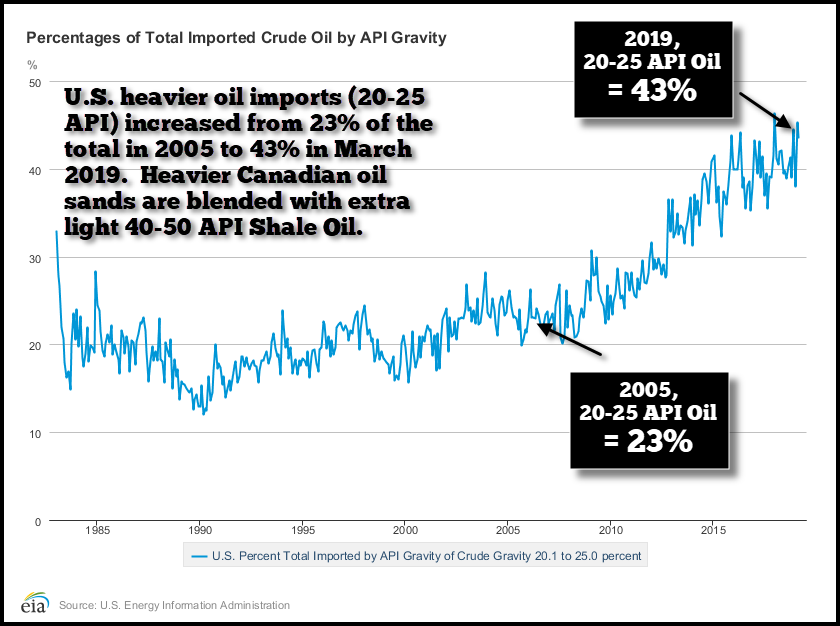
This chart shows the increase in U.S. 20-25 API oil from 23% of total imports in 2005, to 43% currently. Our largest oil imports come from Canada, and according to the EIA, the United States imported 3.9 mbd from its northern neighbor, accounting for 56% of the total 7 mbd of crude oil imports. So, there you have it, as unconventional U.S. shale oil production surged, the U.S. was forced to import lower grade unconventional Canadian oil sands as a blending agent to make something useful for its refineries.
In conclusion, on occasion, the United States might look like a Net Oil Exporter on paper, but the truth of the matter is that much of our petroleum exports are of lower quality that we have no use for. Even if the United States becomes more of a net oil exporter in the future, it will still be forced to import a significant amount of medium grade and heavier oil designed for its refinery industry.
Unfortunately, the economics of shale continues to weaken, and I would not count on growing production from the industry for years to come. We will likely see a peak in U.S. shale oil sooner than later, and that should be the final nail in the coffin for the U.S. as a PAPER NET OIL EXPORTER.
