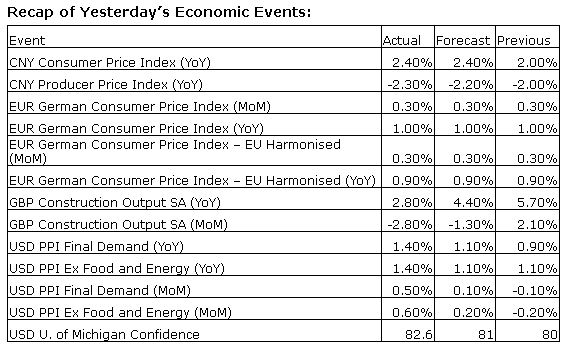
Upcoming US Events for Today:
- Retail Sales for March will be released at 8:30am. The market expects a month-over-month increase of 1.0% versus an increase of 0.3% previous. Less Autos and Gas, the increase is expected to show 0.5% versus an increase of 0.3% previous.
- Business Inventories for February will be released at 10:00am. The market expects a month-over-month increase of 0.6% versus an increase of 0.4% previous.
Upcoming International Events for Today:
- Euro-Zone Industrial Production for February will be released at 5:00am EST. The market expects a year-over-year increase of 1.5% versus an increase of 2.2% previous.
The Markets
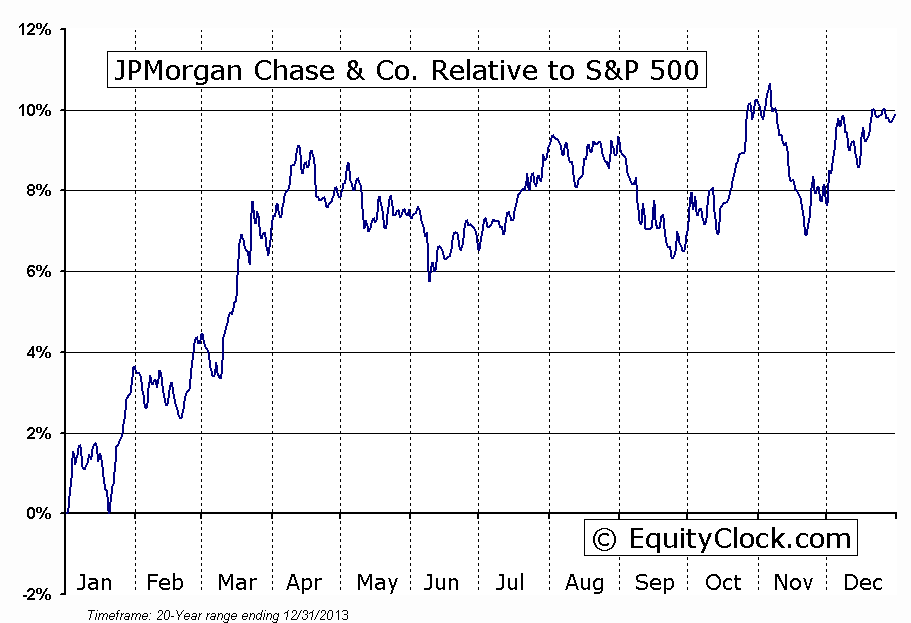
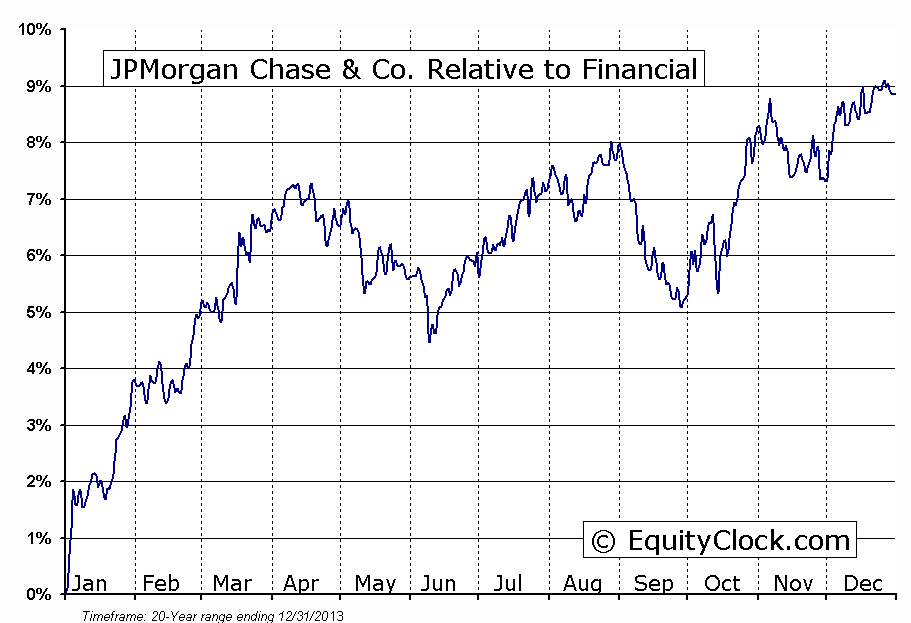
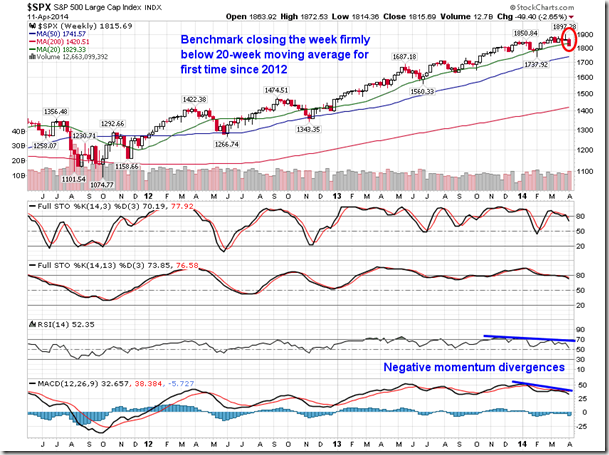
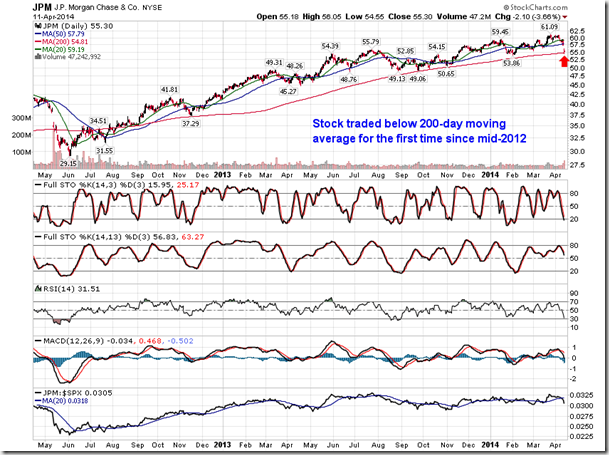
Stocks continued to slide on Friday, capping off the worst week for equity benchmarks since June of 2012. The S&P 500 closed lower on the week by 2.65%, finishing firmly below the 20-week moving average and raising concerns that a much more substantial correction is underway. The last time the large-cap benchmark closed this far below violated support at the 20-week moving average was also in 2012. The Financial sector placed additional strain on an already fledgling equity market on Friday as one of the largest stocks in the sector, JP Morgan, reported earnings that missed estimates; financials was one of the worst performing sectors during the session. The company reported earnings of $1.28 per share, down from the $1.59 per share reported a year ago and below estimates calling for $1.41 per share. Revenues also missed. The stock dropped 3.66% by the closing bell, briefly trading below the 200-day moving average for the first time since, you guessed it, 2012. Positive seasonal tendencies for JP Morgan (JPM), and the broad financial sector, conclude at this time of year; JPM typically underperforms the market and the sector from mid-April through to mid-June.
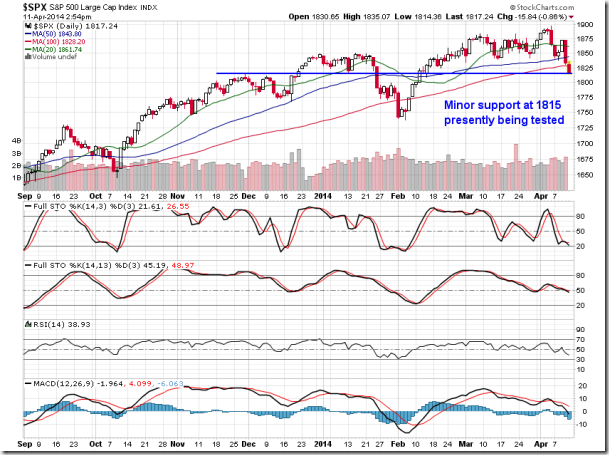
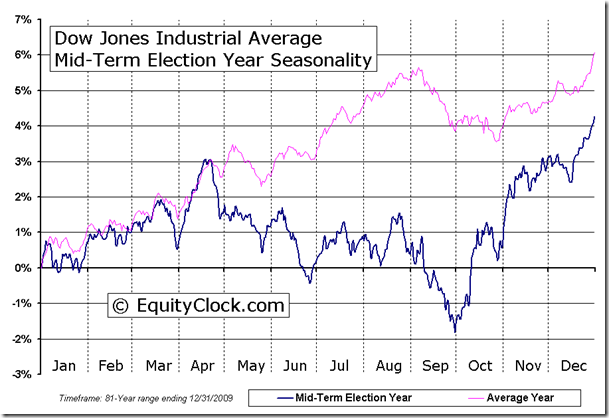
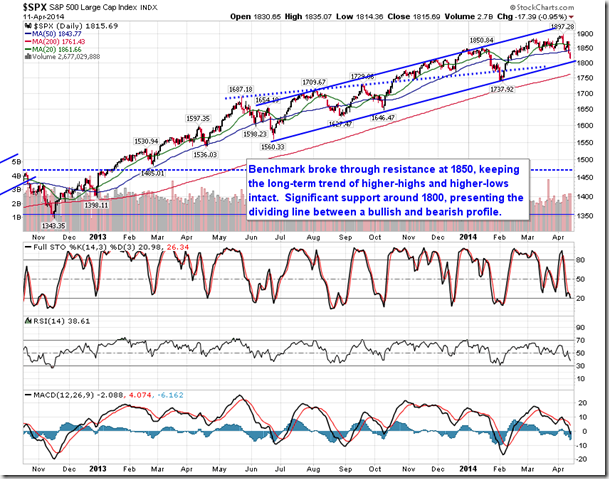
Turning back to the S&P 500, the benchmark came down and tested minor support at 1815, holding that level through to the closing bell on Friday. The 20-day moving average of the benchmark is curling lower, suggesting a negative short-term trend; the 50 and 200-day moving averages continue to point higher, implying positive intermediate and long-term trends remain intact. Negative momentum divergence with respect to MACD and RSI can still be identified, which confirm the waning strength that the broad market is realizing. Trendline support for the large-cap benchmark continues to hover around 1800, a level that still has a good likelihood of providing some support to this market. However, a break below 1800 would suggest the end of the long-term positive trend that began in November of 2012. The Nasdaq Composite has already broken the equivalent level of trendline support, perhaps foreshadowing events to come for the rest of the broad market. Remember, during mid-term election years, the stock market peaks, on average, in the month of April; equity markets peak, on average, by the start of May during any given year. Under both scenarios, we are well within the timeframe when a seasonal peak is typically realized.
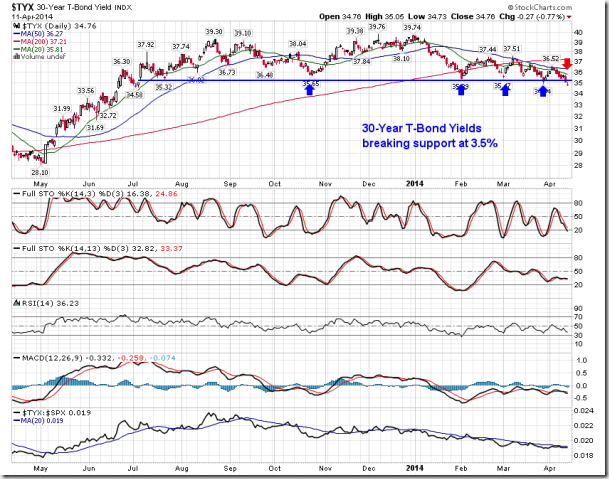
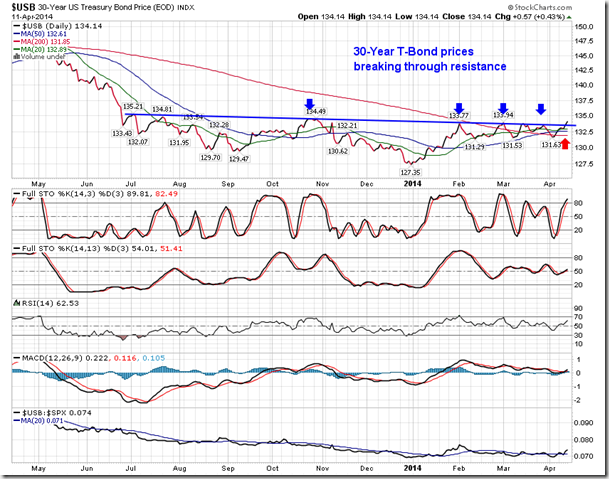
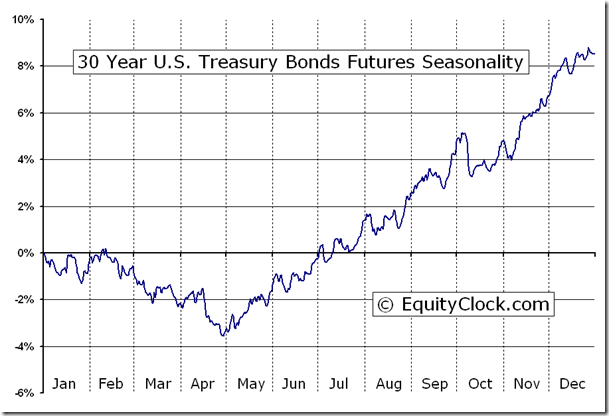
One of the warning signs that suggests an equity market peak may have already been realized is the strength of the bond market. On Friday, the 30-year treasury bond yield broke through long-term support at 3.5%; price of the 30-year T-bond broke above long-term resistance around $133.50. A head-and-shoulders topping pattern on the chart of the 30-year yield suggests downside potential remains with an implied target of 3.1%, a move that would likely be accompanied by equity market weakness as investors rotate from one asset class to the other. Bonds have been bucking the typical seasonal trends for well over a year now as speculation over how the Fed will act distorts the often reliable trade; positive seasonal tendencies for bond prices begin, on average, at the beginning of May.
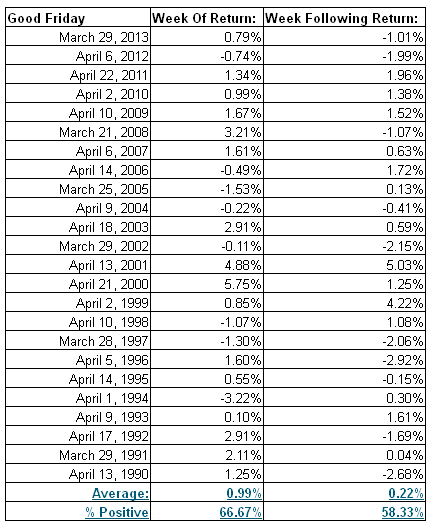
The week ahead is a holiday shortened week with Good Friday shutting markets in both the US and Canada. As with other holiday shortened periods, positive equity market returns are typical. During the four day week leading into the Good Friday holiday, the S&P 500 has returned an average of 0.99%; positive results were realized in 67% of periods since 1990. Gains are much more subdued during the week following the Good Friday holiday with the large-cap benchmark returning an average of 0.22%. Given that most equities are at or approaching short-term oversold levels, a bounce would not be unexpected.
S&P 500 Returns during the week of and the week following Good Friday:
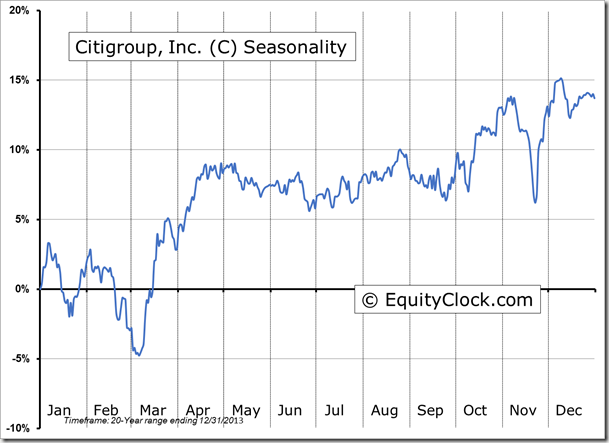
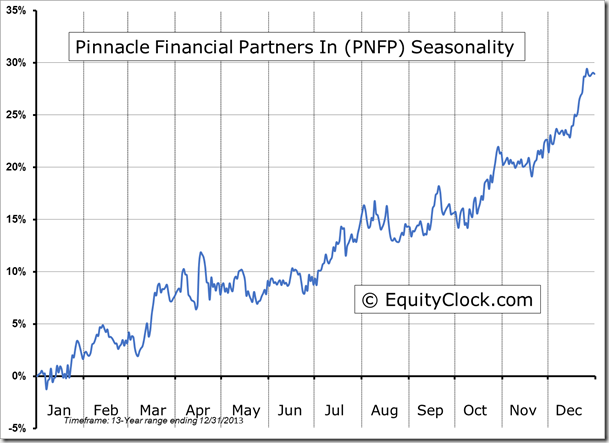
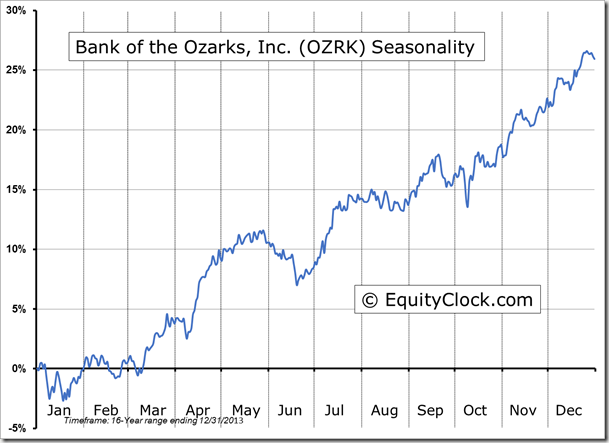
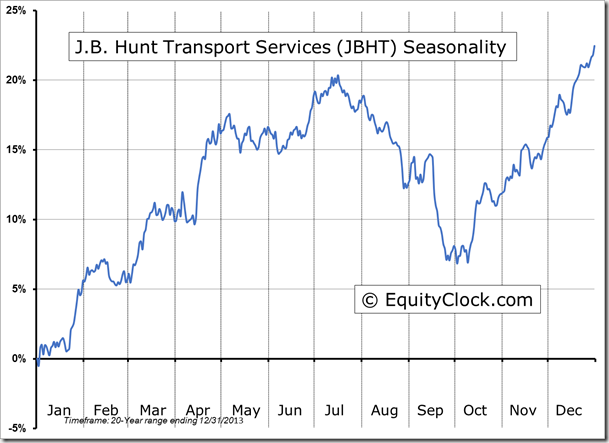
Seasonal charts of companies reporting earnings today:
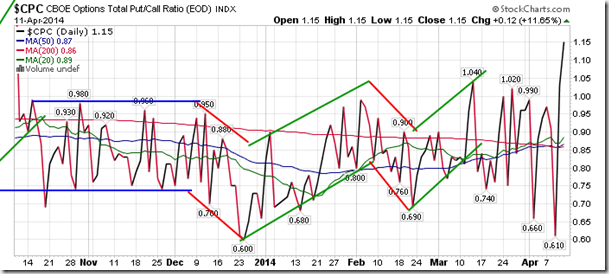
Sentiment on Friday, as gauged by the put-call ratio, ended bearish at 1.15. This is the highest put-call ratio since October 9th of last year, in the midst of the government shutdown that lasted a little over two weeks. Fortunately, for equity investors, when the put-call ratio hit the overly bearish peak last October, a short-term low in equity markets was charted, leading into strong fourth quarter gains. The range of values provided by the put-call ratio over recent weeks continues to suggest indecision and volatility, a scenario that does not play out well for equity markets over the intermediate-term.
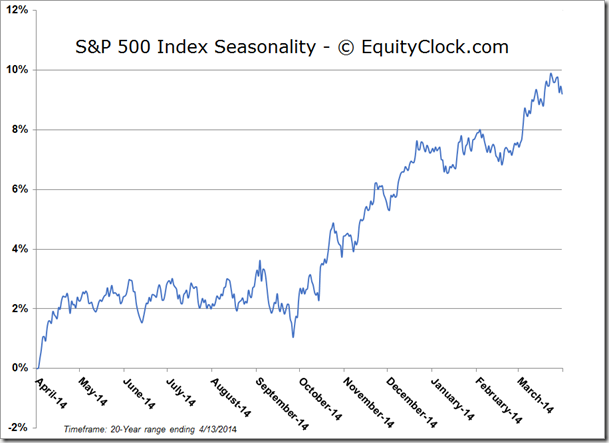
S&P 500 Index
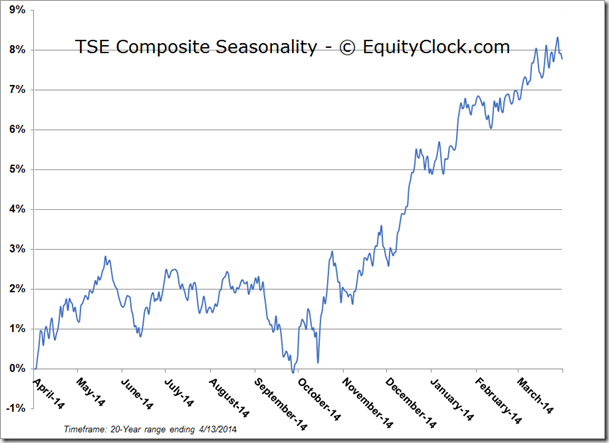
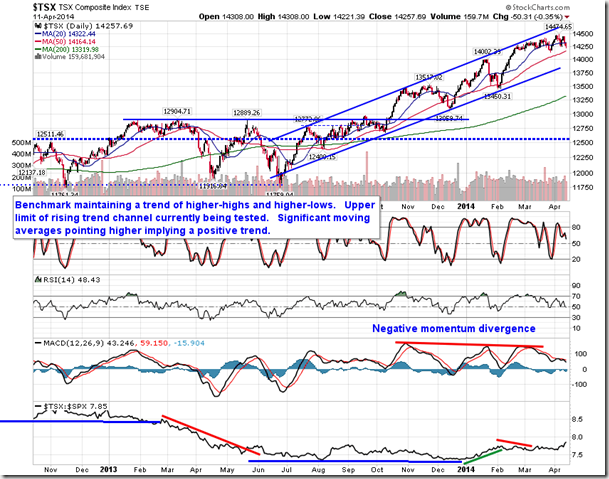
TSE Composite
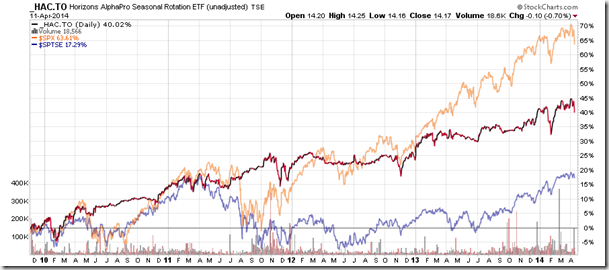
TSX: Horizons Seasonal Rotation (HAC.TO)
- Closing Market Value: $14.17 (down 0.70%)
- Closing NAV/Unit: $14.18 (down 0.91%)
Performance*
| 2014 Year-to-Date | Since Inception (Nov 19, 2009) | |
| HAC.TO | -0.84% | 41.8% |
* performance calculated on Closing NAV/Unit as provided by custodian

