While we watch the drama over the demise of Hostess Brands, the financial media hums with the suggestion that the silly labor movement, as well as business errors have driven this company into the ground.
Additionally, the American labor movement (aka Unions) and their continuing demands for more money and better working conditions have been alleged to be responsible for the export of jobs to offshore manufacturing facilities where the labor cost was lower, and where the foreign workers were just thankful to have a job.
I have never carried a union card, and except for a short period in my career – I have always managed union labor. At times they have been a pain, other times illogical – but the unions always have delivered quality experienced workers. And usually the trade unions helped in productivity enhancements with supportive work rules – it worked out as a good marriage as we were always competing against non-union shops.
In many instances, it is the apprenticeship programs of the unions which have trained our workforce. Anyone who sees the union movement as purely a negative force has spent too many hours watching CNBC and FOX news.
Neither unions or management are purely good or bad. There are stories which can be told. But unions are an important element in the world of Joe Sixpack. Joe needs a friend to have his back against the “man” who indiscriminately sets wages and working conditions.
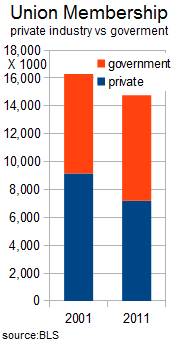
The biggest gain for Joe’s unions in the 21st century has been in government. Governments are faceless political bureaucratic machines – a perfect environment for ignoring their workforce until the workforce squawks. Union membership growth has been roughly equal to the growth of the total government workforce – over 5%.
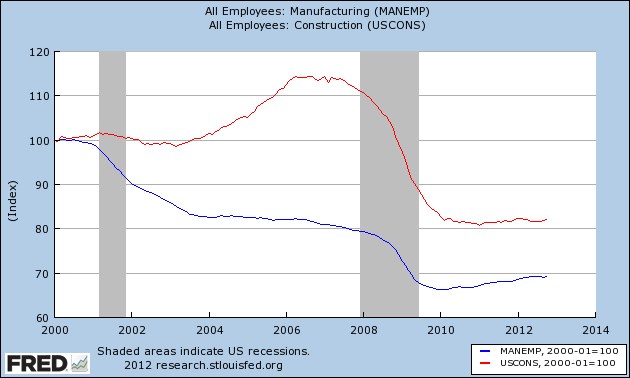
In the private sector, where the workforce is roughly 5 times larger than government – the workforce has grown 2% while union membership has fallen over 21%. The biggest losses are in construction (no surprise here) – followed by production, transportation, and material moving occupations (again no surprise).
All and all – we can generally say union membership has approximately maintained its representation levels in its historical sectors of the hired workforce over the past decade. It is the employment in these sectors of the workforce which declined. So what really is the problem with the union movement? As I see it it it is not the unions at the heart of the problem. The kernel is the human/machine interaction.
In a previous post, I observed:
In a 24 hour / seven day a week environment, the robot would be advantageous in any environment where the cost of labor exceeded $1 per hour. Robots hardly get sick, do not sue their employer, and will work in terrible / hazardous conditions. Robots literally are making the cost of manufacturing labor $1 per hour around the world.
Any manual activity which is programmable will be replaced eventually – whether it is in the USA or offshore. Workers today in almost all countries cost the employer more than $1 per hour. To remain competitive a business has no choice but to continue to automate or die.
The demand for Hostess branded products will not go away – and:
- others will buy the facilities and brands – will continue to manufacture the products [workforce remains unchanged]; or,
- others will buy the brands and move them to a more cost effective (productive) facility [workforce smaller - and different than the existing workforce, may not be union]; or,
- facilities and brands die – demand for similar products rise [changes in employment will depend on the labor capacity slack in that similar facility].
A total of 18,000 workers are impacted with the demise of Hostess.
Yet all workers should be concerned about the effects of workforce dynamics and competitiveness due to robotics – as well as other pressures on business competitiveness including USA taxation of its own manufacturers while giving the imports a pass. These are the dynamics forcing the reduction in the cost of labor – and with lower income, it is a headwind to consumption. This has the potential of becoming a nasty spiral of reduced income –> reduced spending –> reduced income.
The current dynamics are against the middle class, and particularly Joe Sixpack. The current economy has:
- deflated real estate.
- deflated the Middle Class.
- deflated Twinkies.
The Econintersect economic forecast for November 2012 showed barely moderate growth, but the the underlying data used to forecast was very mixed. To use a technical term – the data was wacky, and as an analyst leaves me with an uncomfortable feeling. However, the good data was stronger than the bad data, and our alternate forecasting tools validated our forecast.
ECRI is still insisting a recession is here (a 07Sep2012 post on their website). ECRI first stated in September 2011 a recession was coming . The size and depth is unknown. The ECRI WLI growth index value is enjoying its twelfth week in positive territory (but at a nine week low this week). The index is indicating the economy six month from today will be slightly better than it is today.
Current ECRI WLI Growth Index 
Initial unemployment claims fell slightly from and 18 month record high 439,000 (reported last week but revised up this week to 451,000) to 410,000 this week. Hurricane Sandy continues to be the villain. Historically, claims exceeding 400,000 per week usually occur when employment gains are less than the workforce growth, resulting in an increasing unemployment rate (background here and here).
The real gauge – the 4 week moving average – rose significantly from 383,750 (reported last week) to 396,250. Because of the noise (week-to-week movements from abnormal events AND the backward revisions to previous weeks releases), the 4-week average remains the reliable gauge. This is the highest 4 week average in over one year, and is up 1.0% year-over-year.
Weekly Initial Unemployment Claims – 4 Week Average – Seasonally Adjusted – 2010 (blue line), 2011 (red line), 2012 (green line) 
Bankruptcies this Week: Pipeline Data,
Data released this week which contained economically intuitive components (forward looking) were:
- Rail movements (where the economic intuitive components indicate amoderately slightly expanding economy).
- Container counts showed unexpected strength
All other data released this week either does not have enough historical correlation to the economy to be considered intuitive, or is simply a coincident indicator to the economy.
Click here to view the scorecard table below with active hyperlinks.
Weekly Economic Release Scorecard:
