One of the weirdest trends over the last year has gone largely unreported. Despite stocks surging 30% in a year, investors are still selling stocks more than they’re buying.
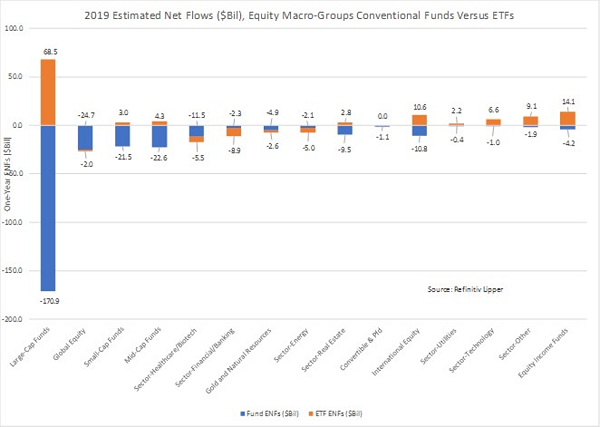
It’s hard to get your head around this fact, but the data says it’s true. According to data from Refinitiv Lipper, investors actually withdrew $192.3 billion from mutual funds and ETFs—the largest amount of outflows on record for a single year.
Stocks Soar—and Investors Sell?

The concept here is a little complicated, but it’s crucial to understand. An ETF or mutual fund pools together cash from its investors, which it then uses to buy stocks, bonds or whatever its mandate says it needs to buy. So, for instance, if you buy $1,000 of the SPDR S&P 500 ETF (NYSE:SPY), you’re telling the fund to go buy $1,000 worth of stocks (after fees, which are too small to matter here). When you put that $1,000 in, that’s an inflow
At the same time, if Investor X takes $3,000 out of SPY at the same time you’ve put in $1,000, the fund essentially has an inflow of $1,000, an outflow of $3,000, and thus a net outflow of $2,000. It won’t actually buy more shares; it will just sell $2,000 of stocks and return that $2,000 and your $1,000 in cash to Investor X, while crediting you with $1,000 worth of SPY’s portfolio.
Now blow that scale up to millions of investors doing billions of transactions, and you see that the money going into ETFs is dwarfed by the money going out—and the discrepancy is largest in large-cap stock funds, where $102.4 billion of net outflows was returned to investors who decided they didn’t want to hold stocks.
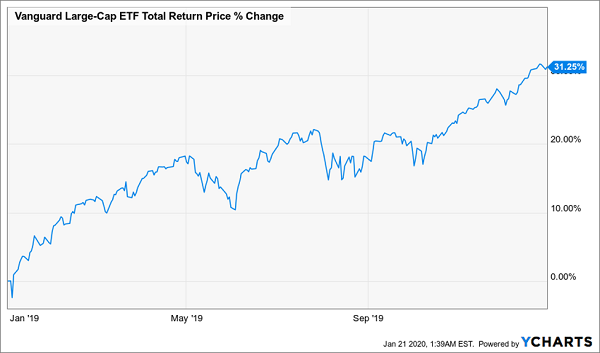
Meanwhile, large-cap stocks did this:
Large Caps Soar

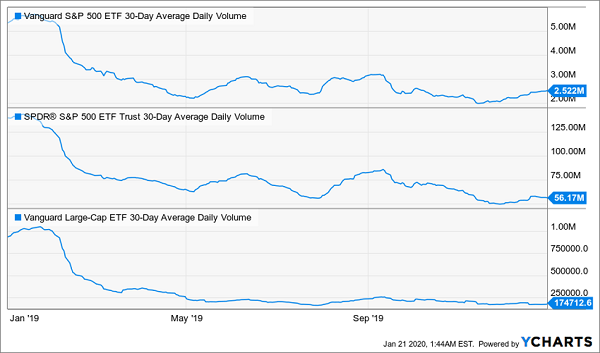
Despite lower market demand, the large-cap-focused Vanguard Large-Cap ETF (NYSE:VV) was up over 30% in 2019, making it one of the top-performing index funds of the year. The lowered demand was also visible in volumes, which plummeted for pretty much all index funds in 2019:
Less Trading From Less-Interested Buyers

This was all happening at a time when stocks were soaring. So what does this mean?
The Pro Versus the Amateur
Part of the story is one of human psychology. In the last three years, a new phrase started gaining currency: “the most hated bull market in history.”
In 2016 and 2017, when stocks were soaring and the economy was showing clear signs of recovery, few pundits wanted to admit this was happening. Then pundits started pointing out that pundits were hesitant to admit we were in a strong bull market, and the phrase was born. Then, in 2018, there seemed to be evidence that there was reason to hate the bull market, as it turned into a bear market that freaked out a lot of investors and got them out of stocks in late 2018.
Then stocks recovered, but investors were still scared. The phrase came back with a vengeance, and 2019 was the most hated year of this most hated bull market. All of that negative chatter scared a lot of near-retirees, who not only stayed out of a market with 30% total returns but also kept selling, even as stocks rose higher.
If that’s the beginning of this psychological story, we are very likely at the end of it. Let me show you this chart.
Bear Fears in All Climates

This is a chart of Google (NASDAQ:GOOGL) searches for the phrase “bear market.” The spike in late 2018, when the bear market happened, was obvious. But note how interest in the phrase fell a bit in 2019, but wasn’t really much lower than in 2018 (beyond the spike late in the year), despite the vastly different markets of those two years.
This endless paranoia about a stock downturn can’t last for long. Now that 2020 is shaping up to be a strong year for the markets, and most analysts acknowledge that their pessimistic warnings of a year ago were wrong, it’s only a matter of time until this optimism flows through to investors who are on the sidelines and seeing the billions of dollars of profits they are missing out on by being in cash.
That brings us to the best news in stocks right now: with so much scared money on the sidelines, despite a lack of macroeconomic or fundamental news to justify this paranoia, there is a lot of potential demand for stocks that can help them keep soaring into 2020 and beyond.
Whether you get into this market with an index fund like SPY or you want to hedge your bets with a fund that insures its portfolio with derivatives like the Nuveen S&P 500 Dynamic Overwrite Fund (NYSE:SPXX), or you want to go crazy on dividends and get something like the 12.8% yielding Gabelli Equity Trust (NYSE:GAB), a CEF that is one of many with a focus on US stocks and huge cash dividends, it’s going to be hard to lose money in a market where so much money is doing nothing and so many profits are on the horizon.
And since many CEFs trade at a discount to NAV, unlike ETFs, they’re a much better bet for a future of retail-investor cash flooding markets and looking for any underpriced asset they can get.
Yours in 2020: 8.8% Dividends, 20% Upside: See How Here
When I say “many CEFs trade at a discount to NAV,” I’m not kidding around: of the roughly 500 CEFs out there, 380 are trading at discounts to net asset value (NAV, or the value of their underlying portfolios) as I write this.
These discounts are basically free money! And they nicely set us up for more upside than you’ll ever see from a comparable ETF.
Better still, these under-the-radar funds throw off huge cash dividends, with the average CEF yielding 7% as I write this. Compare that to a pathetic payer like SPY, with its meager 1.7% yield.
And plenty of CEFs yield even more than 7%, like the incredible 8.8% average yield paid by my 4 top CEFs for 2020 (and beyond). In other words, when you put your cash into these 4 funds, you’re essentially getting the historical return of US stocks in dividend cash alone, not to mention price gains.
And speaking of price gains, the discounts on these 4 funds are so big, I’m fully expecting their market prices to jump 20% by this time next year—not including their huge cash payouts!
Disclosure: Brett Owens and Michael Foster are contrarian income investors who look for undervalued stocks/funds across the U.S. markets. Click here to learn how to profit from their strategies in the latest report, "7 Great Dividend Growth Stocks for a Secure Retirement."
