On Friday, “Phase One” of the “Trade Deal” was agreed to, with the Trump Administration originally stating that “Phase Two” would not begin until after the 2020 election.
Then reality set in.
Since 2018, President Trump has come to understand that if the market declines, a “tweet” about a “trade deal coming” would spark a market rally. Without a “trade deal” to negotiate, there is no catalyst to support asset prices heading into the election. This is why on Friday, Trump immediately declared that “Phase Two” of the trade deal would begin immediately.
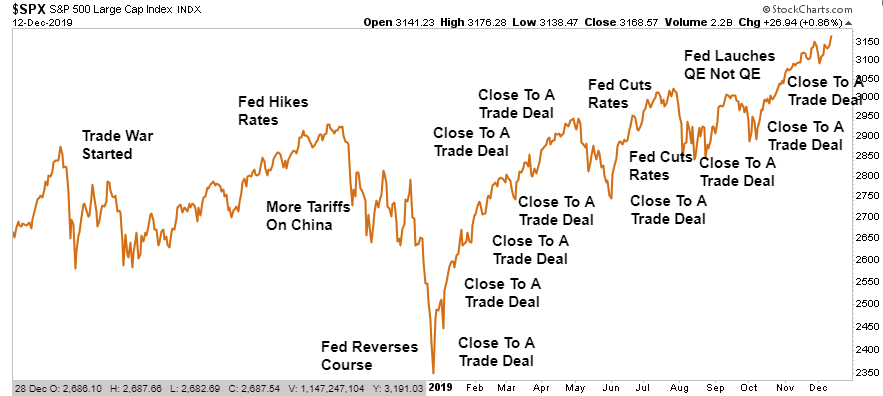
Long live the “trade war.”
In our “Macro View” piece below we go into much more detail about the “trade deal” and what to expect next. However, from an investment view, the agreement is clearly about two things:
- Boosting exports of Agricultural Products; and,
- Devaluing the Dollar.
With the Fed giving up on their mandate to maintain price stability, (they recently stated they will let inflation “run hot,”), the path was cleared for the Trump Administration to devalue the U.S. dollar (which is inflationary) without worries the Fed will start hiking rates.
This is one of the reasons we have started laying commodity exposure into our portfolios with the recent positions in precious metals and energy.
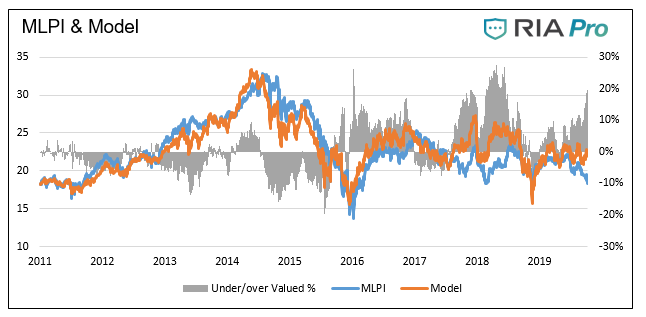
“This model forecasts the price of MLPI based on changes to the price of Energy Select Sector SPDR® Fund (NYSE:XLE) and the yield of U.S. 10-year Treasury Notes. The model below has an R-squared of .76, meaning 76% of the price change of MLPI is attributable to the price changes of energy stocks and Treasury yields. Currently the model shows that MLPI is 20% undervalued (gray bars). The last two times MLPI was undervalued by over 20%, its price rose 49% (2016) and 15% (2018) in the following three months.”
The Demise Of The Dollar
As shown in the chart below, the dollar has broken below both its rising trendline from its previous lows and the 200-dma.
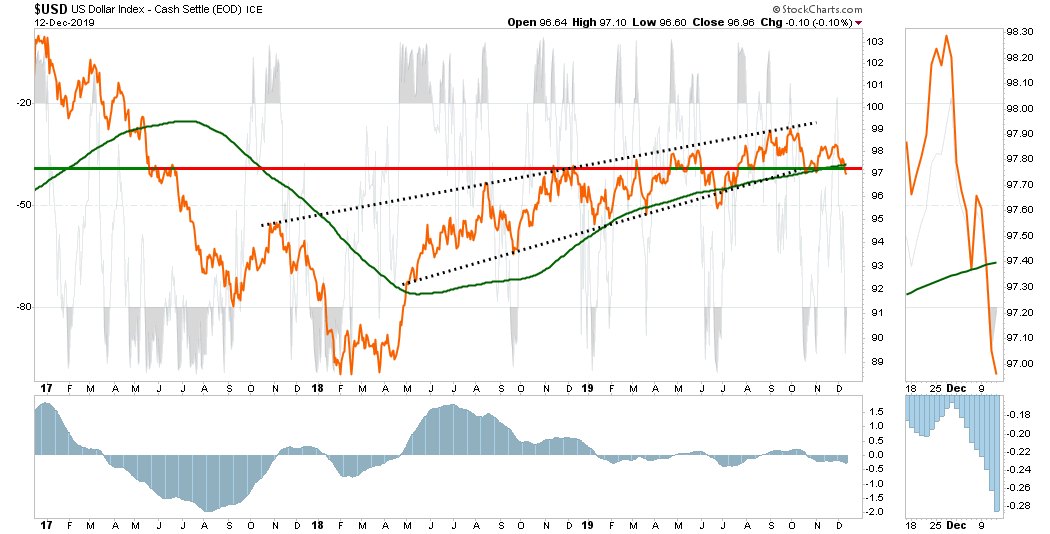
(We cover the dollar and positioning each week for our RIAPRO subscribers because the dollar impacts exports which makes up about 40% of corporate profits.)
Currently, the breakdown is very early in it potential progress. As we saw in June, that breakdown was short-lived before it reversed as foreign dollars continue to poor into USD denominated assets for both safety and higher returns than elsewhere in the world.
We previously discussed this important point in “The Great Cash Hoard Of 2019.”
“As it relates to foreign positioning, it is worth noting that EURODOLLAR positioning has been surging over the last 2-years. This surge corresponds with the surge in dollar-denominated money market assets.
What are Euro-dollars? The term Eurodollar refers to U.S. dollar-denominated deposits at foreign banks, or at the overseas branches, of American banks. Net-long Eurodollar positioning is at an all-time record as foreign banks are cramming money into dollar-denominated assets to get away from negative interest rates abroad.”
Importantly, when positioning in the Eurodollar becomes extremely NET-LONG, as it is currently, the reversal of that positioning has been associated with short- to intermediate corrections in the markets, including outright bear markets.
What could cause such a reversal? A pick up of economic growth, a reversal of negative rates, a realization of over-valuation in domestic markets which starts the decline in asset prices, or the devaluation of the US Dollar.
A reversal of positioning would spark a virtual spiral, with assets flowing out, which lowers asset prices, leading to more asset outflows. While the bulls are certainly hoping the “cash hoard” will flow into U.S. equities, the reality may be quite different.
Watch the dollar closely.
Santa To Visit Broad and Wall
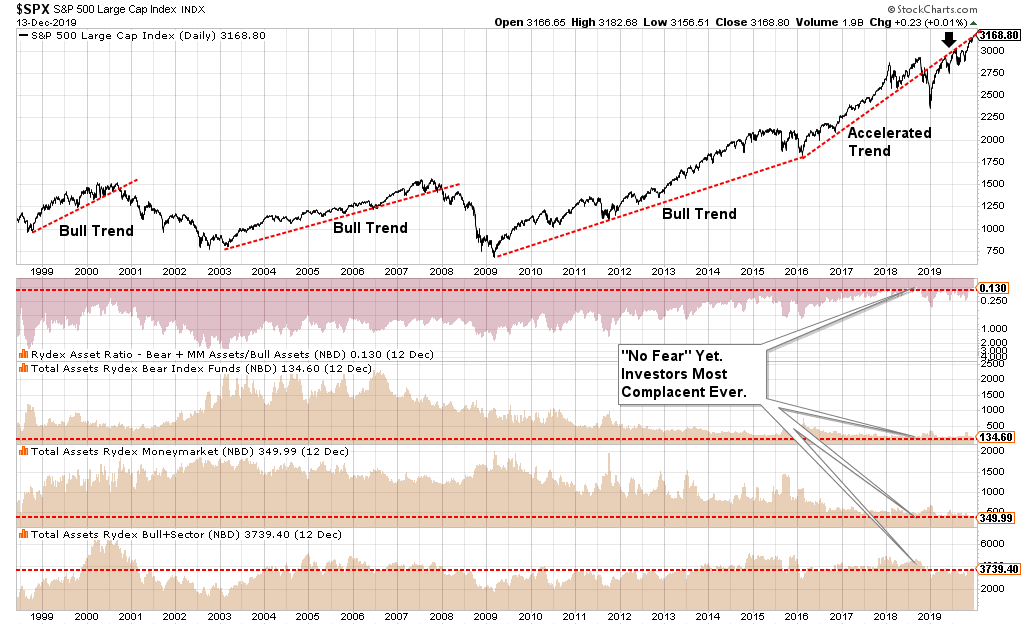
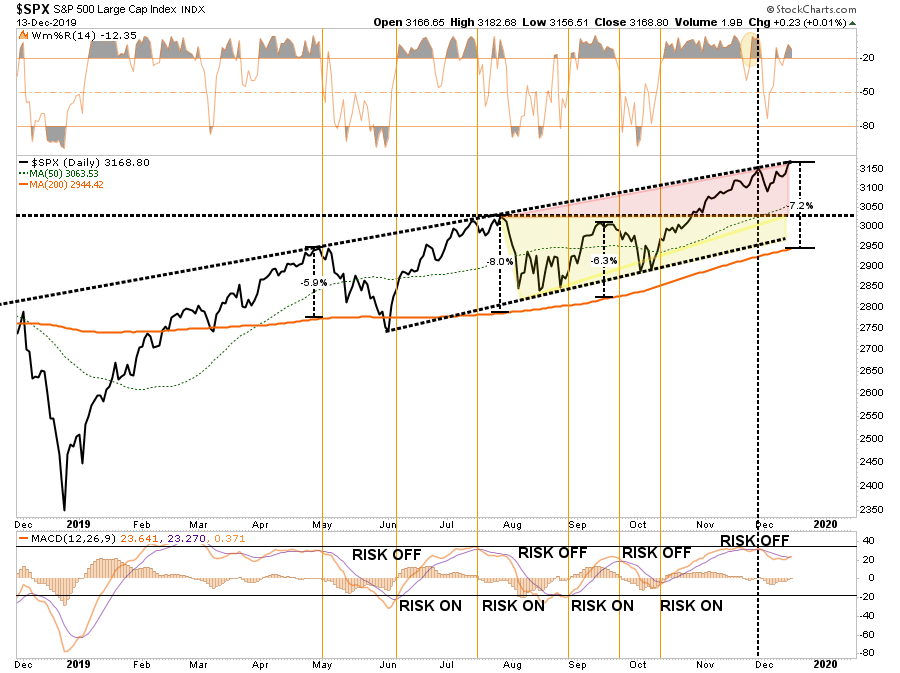
As we head into the last two weeks of the year, and the decade, it is time for Santa to visit “Broad and Wall.” While I expect the markets to try to rally into year end there are a couple of caveats which could derail that optimism.
- Currently, “bullish sentiment” and “optimism” is once again extremely lopsided.
- Currently, investor cash is at extremely low levels, with investors fully allocated to equity risk.
This is a sharp reversal from this summer when “everyone” thought a “recession” was near. Lastly, the markets are back to extremely extended and overbought conditions in the short-term which suggests the majority of the current advance has been made and a correction is needed before a further advance can be made.
With the market currently overbought and more than 7% above the 200-dma, corrections usually come before the next advance ensues. Such suggests being a little prudent in adding exposure too aggressively and look for weakness to opportunistically position portfolios.
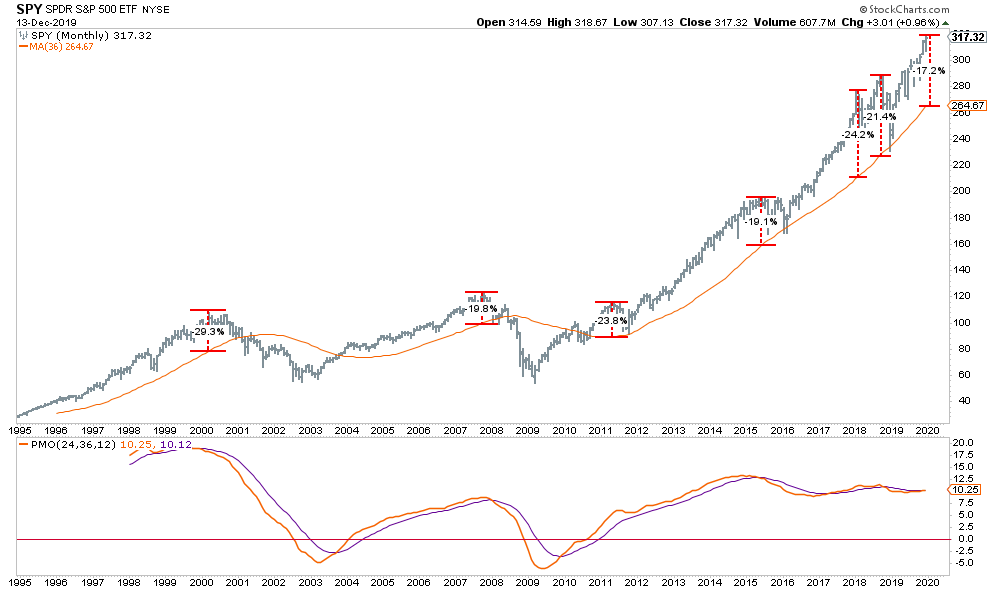
On a monthly basis, we see much the same deviation from long-term (3-year) moving averages. Historically, when extensions from the long-term moving average are this extreme, corrections have tended to occur. In most instances that reversion entailed a correction back to the long-term mean.
Rules For A Santa Rally
Currently, our portfolio allocations remain primarily long-biased although we are carrying a slight overweight position in cash, we have also recently added positions to take advantage of a potentially weaker dollar, and a steeper yield curve. We also recently took profits in our Healthcare sector which has gotten grossly extended.
These processes follow our basic rules of portfolio management which you can apply to your portfolio as well to reduce overall volatility risk.
- Tighten up stop-loss levels to current support levels for each position.
- Hedge portfolios against major market declines.
- Take profits in positions that have been big winners
- Sell laggards and losers
- Raise cash and rebalance portfolios to target weightings.
Notice, nothing in there says “sell everything and go to cash.”
Remember, our job as investors is actually pretty simple – protect our investment capital from short-term destruction so we can play the long-term investment game. Here are our thoughts on this.
With forward returns likely to be lower and more volatile than what was witnessed over the last decade, the need for a more conservative approach is rising. Controlling risk, reducing emotional investment mistakes and limiting the destruction of investment capital will likely be the real formula for investment success in the coming decade.
