Following the stock market can lead to a roller coaster of emotions. This is what makes it impossible to predict where it might go any given day. The best we can do is try to identify trends and look at past price history to perhaps get a sense of what might be the easier path, and then manage risk if we are wrong. This is a very simple summation of Technical Analysis.
It is shunned by valuation fans as backward looking, and that descriptor is true. We can only ever know price in hindsight. But that is the same for valuation techniques as we. Both have a place in market analysis. Personally I find more day to day value in the technical side as the backward looking feature is at least updated very rapidly, not quarterly. And when I apply it to the Russell 2000 Index ETF ($IWM) it shows some interesting price action the past 7 months.

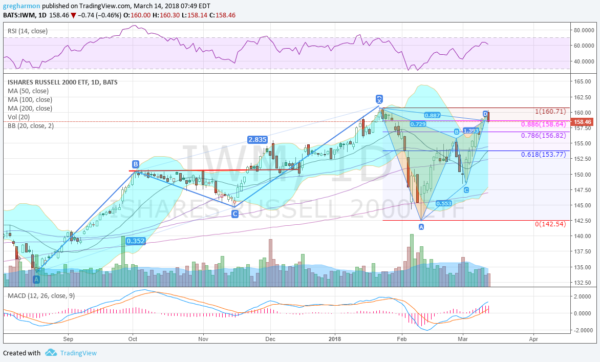
The chart above shows that price action. Starting with a move higher off of a bottom in mid-August. The Russell 2000 rose to a peak at the beginning of October and then drifted back lower, consolidating the move. It retraced nearly 38.2% of the upward leg and then reversed and drove higher, stop just pennies short of completing an AB=CD pattern. Upon completing the pattern a trader would generally look for a pullback, either to the same 38.2% and reversal to complete a 3 Drives, or further to 61.8% or a full retracement.
It gave more than a full retracement, falling back 113% of the move before finding support and reversing. The bounce continued to a top in February and then a pull back to a higher low. And now the move higher has completed a bearish Bat harmonic. The Terminal Price Bar Tuesday at the Potential Reversal Zone (PRZ), an 88.6% retracement of the first leg down, suggests a reversal is in hand. The first target would be to 153.77, a 38.2% retracement of the entire pattern.
The Russell 2000 has been a very technical beast over the last 7 months. Will it continue to be so?
The information in this blog post represents my own opinions and does not contain a recommendation for any particular security or investment. I or my affiliates may hold positions or other interests in securities mentioned in the Blog, please see my Disclaimer page for my full disclaimer.
