In a year when we have seen commentators talking about the relative flatness of yield curves, we have a conundrum when we look at the US Treasury yield curve and the US muni yield curve (shown here as the Bloomberg AA general obligation yield curve).
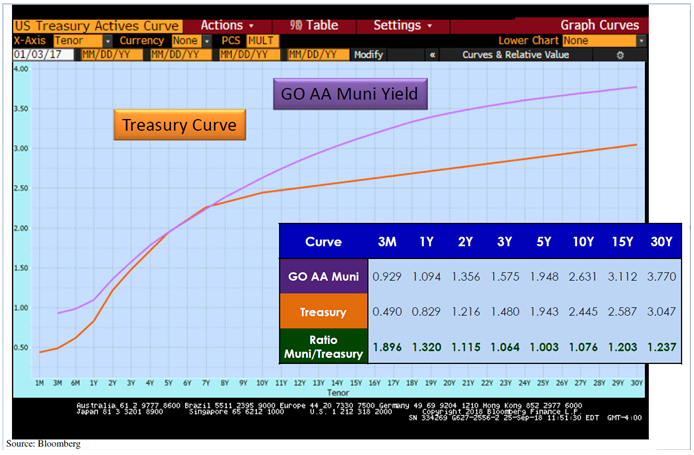
Curve 1 below is from the beginning of 2017. Curve 2 is from September 2017. Curve 3 is from September of this year.

Curve 1, at the beginning of 2017, shows a very cheap muni yield curve across the board. Muni yields were at or above Treasury levels at EVERY POINT ON THE YIELD CURVE. This reflected the entire uncertainty surrounding the presidential election.
There were questions as to whether we would see a tax bill and how munis would be treated, fear of a big infrastructure bill (and uncertainty over how that would affect munis), what the president would do regarding a new Fed chair, and whether Fed policy would change. All in all, it was an extraordinarily cheap moment for muni bonds. The long end was particularly cheap, as the market had undergone a selloff in the wake of the Trump election, with extreme bond-fund selling.
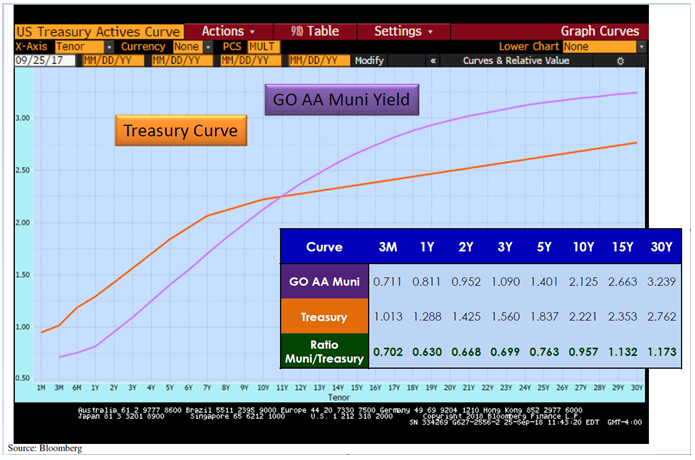
Curve 2

Curve 2 is from September of 2017. What happened?
Short-term muni yields dropped. The trend really started in the first quarter when then-Chair Janet Yellen made it clear that the Fed would continue on its path of raising short-term interest rates gradually (read: not at every meeting) but would need to keep raising rates to reflect an improving economy.
Thus the shorter end of the market essentially began to go lower in yield to reflect the tax structure, and the ratio moves were dramatic for paper inside of five years. Longer munis continued to exhibit cheapness of yield relative to Treasuries.
We believe this was related to market knowledge that there would be a change in the tax code coming with the tax bill and to the uncertainty as to how municipal bonds would be treated under that bill. The expectation was that municipal advance refundings (which allowed municipalities to defease older, higher-coupon bonds in advance of their call dates) would be eliminated. Bond markets also expected that private-activity bonds – issued by charter schools, private universities, state housing agencies, and airports among others – would be prohibited.
In the end the tax bill eliminated advance refundings but allowed private-activity bonds. The cheapness in the long end of the muni market was due to the expectation that SUPPLY would bulge at year end to beat the tax code changes, and indeed that is what happened.

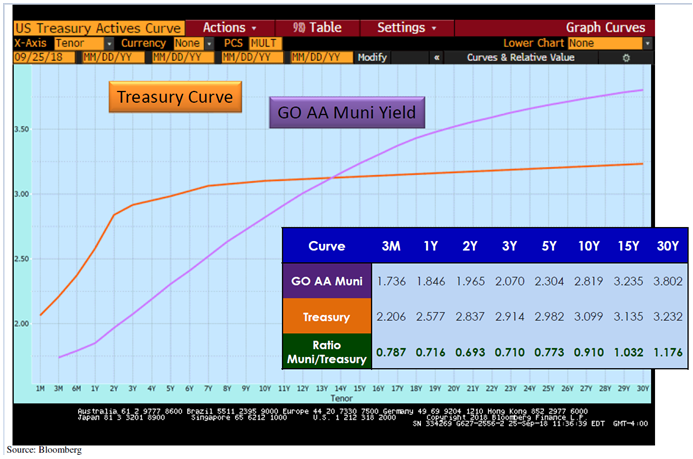
Curve 3 is from this September. Two observations jump out. The long end remains absurdly cheap. One factor is some erosion of the buying base. Banks have been smaller buyers of munis because of the lower corporate rate; and individual demand for long munis has been good, but bond funds have not recouped the outflow of funds that they saw in the wake of the 2016 election. The more dramatic move has been the continued drop in ratios inside of 10 years – in some cases to lower than the break-even rate if we assume an average marginal tax rate of 25%.
One of our thoughts is that investors are expecting a possible change in the makeup of Congress this fall and possibly a change in the White House in 2020 and a potential revision of the tax code again. The current individual rates expire in 2025. Therefore, investors are turning over muni portfolios faster and paying more for short-dated securities. They would therefore have money back faster if there if a tax law change in the wake of a switched Congressional majority.
However, we believe the longer end of the bond market remains an extremely good value. A 4% tax-free yield is the taxable equivalent of 6.35% if an investor is in the 37% top tax rate bracket. For states with high income taxes that are no longer deductible, a 4% in-state bond yield is worth even more. At the top state tax rate, a 4% New Jersey tax-free bond is worth 8.97% taxable equivalent; a 4% New York bond is worth 8.82% taxable equivalent; and a California 4% tax-free yield is worth 8.04% taxable equivalent. This is for AA or higher-rated securities. To position the 4% in-state bond correctly credit-wise, it compares to high-grade corporate and long, taxable municipal bonds at the 4.0–4.5% level or a BB junk bond long yield index of 6.5% (source: Bloomberg). In general, the muni yield curve drifted up 20 basis points during the quarter, across from 2 years out to 30. This is in sympathy with the treasury yield curve, which also experienced slightly higher yield movements across the board.
Curve 3 also is a way to understand Cumberland’s current barbell approach to tax-free bond portfolio management. We want shorter-term securities turning over faster as the Fed raises short-term rates, but we want the longer end locked in because we believe the current cheap yield ratios will eventually go to 100% or below.
This happened during the Fed’s hike cycle of 2004–2006, when long muni/Treasury yield ratios fell from 103% to 85%. Our approach should give long munis a great deal of defensive value if overall interest rates rise. It is this defensive quality that causes us to include some longer tax-free bonds in the management of taxable bond portfolios of clients such as pensions, foundations, and charitable trusts. The total-return characteristics of owning a tax-free bond at these levels is very compelling when the expectation is for lower yield ratios over time. Certainly it will take some time for the strategy to work out, as longer Treasury yields are somewhat anchored to the general low level of longer bond yields in the Eurozone countries.
As the Federal Reserve continues to raise short-term interest rates (and we believe they will continue to do so to get the fed funds rate decently above the level of core CPI [currently 2.2%]), we will eventually move some of the shorter end of the barbell out somewhat longer, some of the longer end (where most bonds are callable) to more noncallable structures, and some bonds to the “belly” of the yield curve (where we don’t want to be now but will certainly want to be if we get to a point where the economy slows).
