The Japanese stock market rocketed higher in mid-November. It did not stay there very long though before pulling back to near the launching point. A fizzled out attempt higher. But the activity over the last two days suggests another assault is under way.

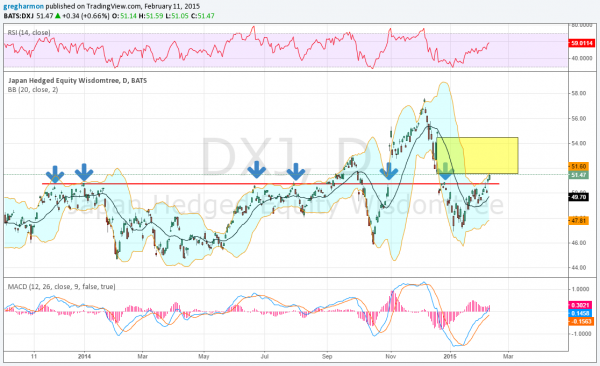
The chart above is for the Japan Hedged Equity Wisdomtree ETF (NYSE:DXJ). It shows the island top clearly. But more importantly, it shows the importance of the level 50.890. That level acted as resistance at the end of 2013, and then again twice in the summer of 2014, before it was briefly ignored. But then again in October and December it became important again.
This week started with yet another rejection at that price level. But on Tuesday and Wednesday we saw the price move over resistance and into the gap (shown by the yellow box). The Bollinger Bands® turning higher as it breaks out. This is the first clue this move could get legs. The momentum indicators also back up further upside. The RSI is rising and on the edge of a move into the bullish zone while the MACD is also rising. Closing the gap to 54.49 would be a good first move, but the Point and Figure chart suggests it could head a lot higher, with a price objective to 90.
All of this happens against the backdrop of a Bank of Japan that has accelerated their quantitative easing. I am long this stock for clients with a March Put Spread as protection.
Disclaimer: The information in this blog post represents my own opinions and does not contain a recommendation for any particular security or investment. I or my affiliates may hold positions or other interests in securities mentioned in the Blog, please see my Disclaimer page for my full disclaimer.
