Years ago I was watching the action around an Atlantic City roulette table when I noticed a man taking careful notes. When I asked what he was doing he said he was looking for long consecutive strings of red or black. If the run got long enough he was going to bet that the ball on the next spin would land on the opposite color because it was “due.”
When I asked him how the ball knew what colors it had previous landed on he frowned and shifted a few steps away.
The Gambler’s Fallacy is an intuitive belief that long streaks, even with fair coins or dice, influence the odds of the next result.
On a day to day basis the stock market is a lot like the game of roulette, with the probability of an up or down day being very close to 50%. However unlike the roulette ball, the people trading on the stock market can remember what has happened previously—so after a long stretch of up days, you would expect a higher probability of a down day. Or so I thought.
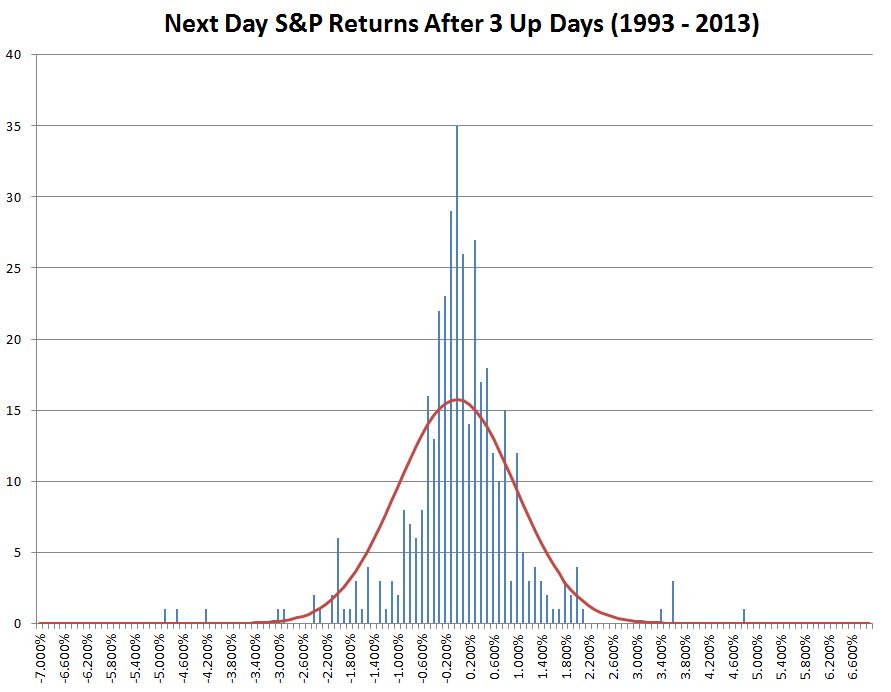
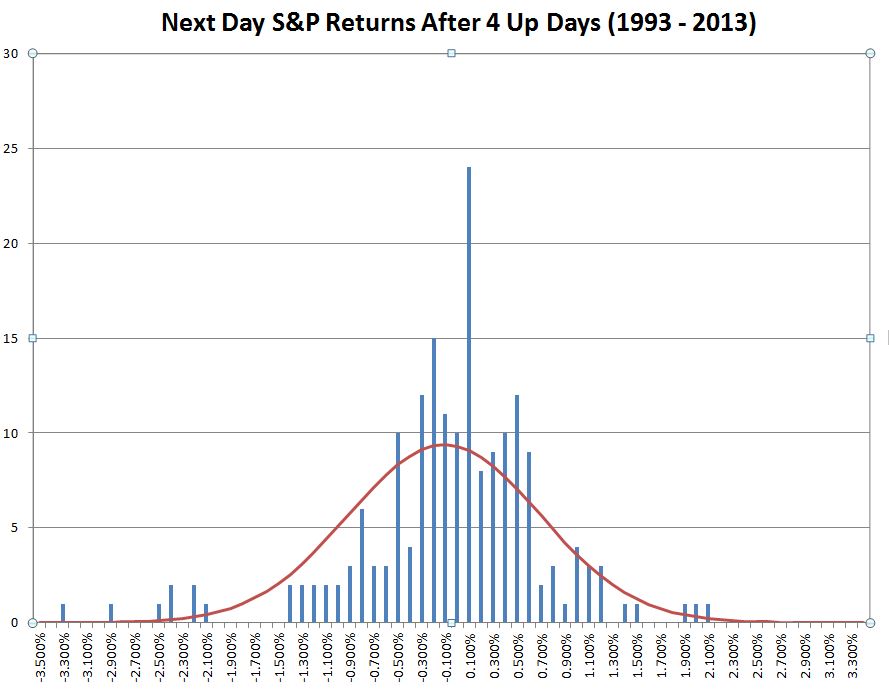
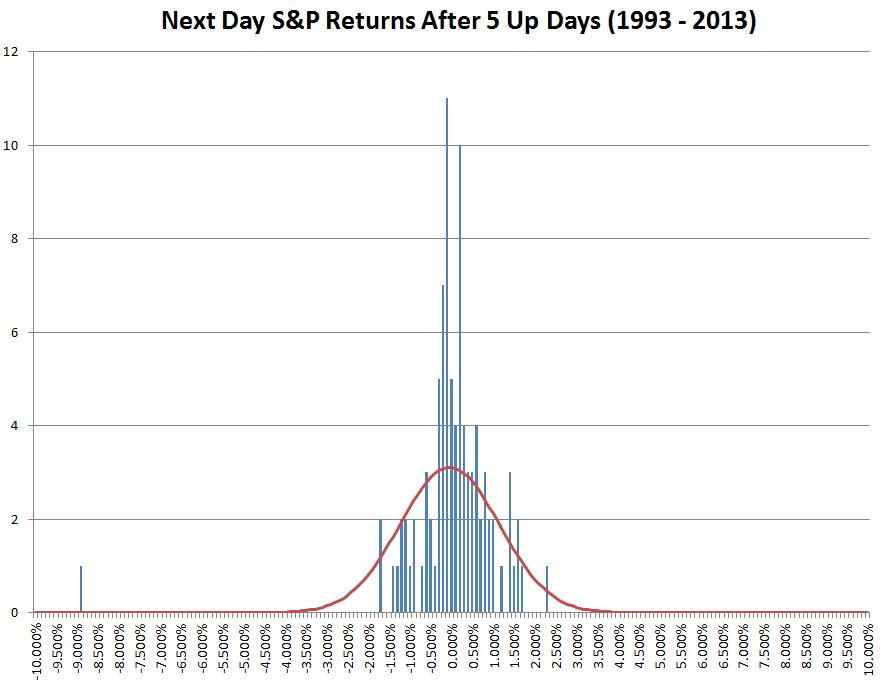
For a long time I’ve believed that the market tends to move in 3 day cycles, but inspired by reading Moneyball (borrow free on Amazon prime), I decided to see if the data supported my intuition. I took the S&P 500 index data from 1993 to 2013 and analyzed market moves after 3, 4, 5, and 6 up days in a row. Rather than just plotting a binary up or down results I plotted the frequency of the percentage results using 0.1% bins.
The red line shows the outline of what a perfect normal distribution would look like. The actual data is more clustered around zero, under-represented on the sides of the distribution, with some “Black Swan” events in the tails of the distribution.
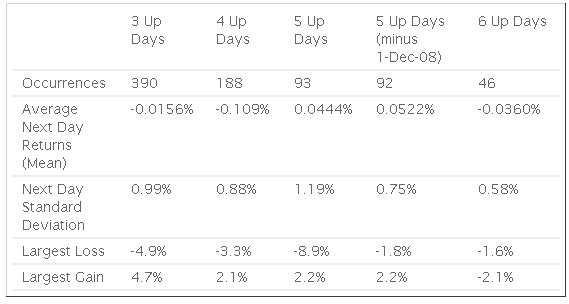
Instead of supporting my intuition the data shows that the stock market is very much like roulette, with no directional bias after three consecutive up days. The average return (mean) is -.016%— indicating very close to even odds.
I repeated the analysis for bull runs of 4, 5, and 6 consecutive days.

These sequences also show average returns close to zero. With even odds the number of consecutive days with gains should decrease by 50% for each additional day—and they do.
The 5 Up Days statistics are distorted by a giant 8.9% drop on 1-Dec-2008 so I show the 5 up data with and without that drop
If you exclude the “7 sigma” event in 2008 there is a trend towards less actual volatility the next day with longer bull streaks. It might be the case that the people involved with the market become increasingly aware of the bull run and start behaving cautiously. This trend would be no help for directional plays, and it’s hard for me to imagine a volatility play that could take advantage of a one day lull.
Clearly my notion that the market moves in 3 day cycles was bogus, and the data suggests that any sort of directional analysis based on market history is just another example of the Gambler’s Fallacy.
- English (UK)
- English (India)
- English (Canada)
- English (Australia)
- English (South Africa)
- English (Philippines)
- English (Nigeria)
- Deutsch
- Español (España)
- Español (México)
- Français
- Italiano
- Nederlands
- Polski
- Português (Portugal)
- Português (Brasil)
- Русский
- Türkçe
- العربية
- Ελληνικά
- Svenska
- Suomi
- עברית
- 日本語
- 한국어
- 简体中文
- 繁體中文
- Bahasa Indonesia
- Bahasa Melayu
- ไทย
- Tiếng Việt
- हिंदी
The Stock Market And The Gambler's Fallacy
Published 11/19/2013, 04:54 AM
The Stock Market And The Gambler's Fallacy
Latest comments
Loading next article…
Install Our App
Risk Disclosure: Trading in financial instruments and/or cryptocurrencies involves high risks including the risk of losing some, or all, of your investment amount, and may not be suitable for all investors. Prices of cryptocurrencies are extremely volatile and may be affected by external factors such as financial, regulatory or political events. Trading on margin increases the financial risks.
Before deciding to trade in financial instrument or cryptocurrencies you should be fully informed of the risks and costs associated with trading the financial markets, carefully consider your investment objectives, level of experience, and risk appetite, and seek professional advice where needed.
Fusion Media would like to remind you that the data contained in this website is not necessarily real-time nor accurate. The data and prices on the website are not necessarily provided by any market or exchange, but may be provided by market makers, and so prices may not be accurate and may differ from the actual price at any given market, meaning prices are indicative and not appropriate for trading purposes. Fusion Media and any provider of the data contained in this website will not accept liability for any loss or damage as a result of your trading, or your reliance on the information contained within this website.
It is prohibited to use, store, reproduce, display, modify, transmit or distribute the data contained in this website without the explicit prior written permission of Fusion Media and/or the data provider. All intellectual property rights are reserved by the providers and/or the exchange providing the data contained in this website.
Fusion Media may be compensated by the advertisers that appear on the website, based on your interaction with the advertisements or advertisers.
© 2007-2025 - Fusion Media Limited. All Rights Reserved.
