Financial markets end the year on a high note, supported on the one hand by improved macroeconomic indicators, and, on the other, by hopes for an early signing of the first phase of a trade agreement. On Wednesday, US President Trump said that preparations are underway for the official signing ceremony of Phase One. On the Chinese side, we are witnessing tariffs cut, which is also a good sign for deal.
However, January often comes with a reassessment of the previous market movement. It was an upward reversal in January 2019, but it looks more like the exception than the rule. More commonly in recent years, following the strong October-December chord, at some point in January, the markets came under pressure. In this regard, it may well turn out that the beginning of 2020 may be a repeat of 2018. Even more fierce highs followed the acceleration of growth at the end of 2017 in the first few weeks. But then the markets corrected sharply. It may well turn out that this time too, the financial markets have not yet put the positive of the trade agreement into prices. Acting on the principle “buy rumours, sell facts”, market participants may well pull the stocks up until the moment of signing, which is still undefined.

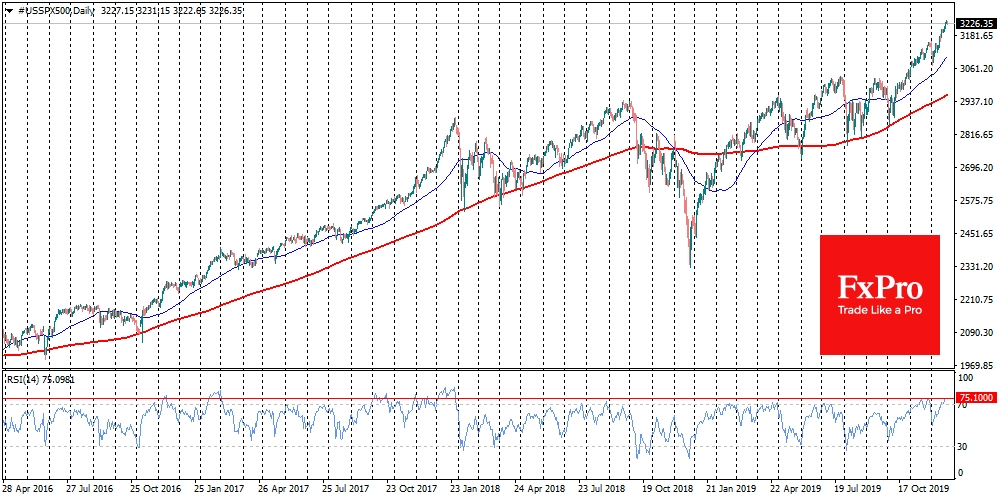
However, fans of technical analysis are already on alert. On the daily charts of Dow Jones, RSI declined from the overbought territory, which may be the beginning of a deeper sale. In the other two indices, the S&P 500 and Nasdaq100, the Relative Strength Index has been running far in the overbought area, reaching its highest levels since January 2018. Formally, the signal for an in-depth correction is the decline of the RSI back into the levels below 70, so there are no direct signals for broad selling from this indicator.
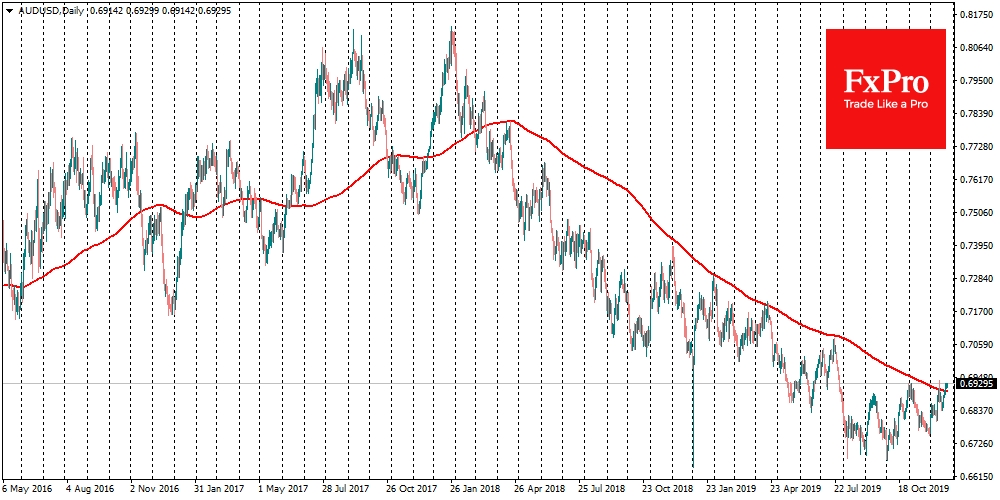
The mood on the currency markets has also improved somewhat today. The yen reversed towards the decline against the dollar, sending the USD/JPY to 109.55 close to the six-month high. Another indicator of Asian investors’ optimism, the AUD/USD, is testing its 6-month highs at 0.6930, strengthening its position above the 200-day average. A decline below 0.7000 was seen as a sign of disappointment in the Chinese and global economic outlook so that the return could be a reliable, albeit somewhat delayed signal.

The positive dynamic of the Chinese side, in turn, helped USD/CNH to slide down to 7.00 at the opening of trading on Thursday. However, at the time of writing the pair is at 6.9960, only a step below this mark.
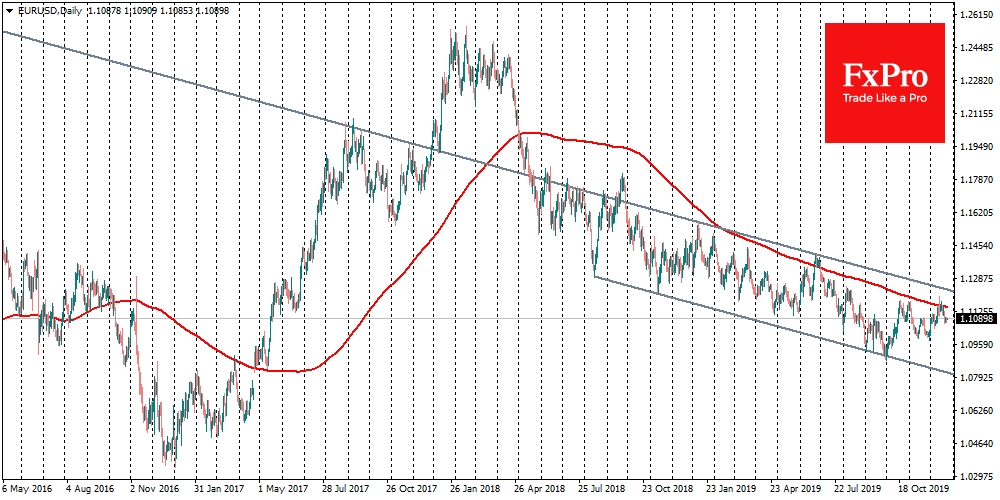
Among the key currencies, the rebound of GBP/USD draws attention. The pair rose to 1.2990 versus Monday’s low at 1.2900, but it looks more like the players are trying to reach the round level of 1.3000 by the year-end than the start of sustainable increase. The EUR/USD remains slightly below 1.1100, and it is making some growth attempts following the positive sentiment of the FX. In December, the pair received massive support after touching 1.1000, so the markets are pulling to the next round level at 1.1100, shifting the central battle for the trend to the beginning of next year.

The FxPro Analyst Team
