Bottom Line: Soybean Meal has erupted through short term resistance. Soybeans have moved up off of short term support. Soybean Oil has been moving up since September ’15 and is now deciding what its next move will be.
Soybean Oil 
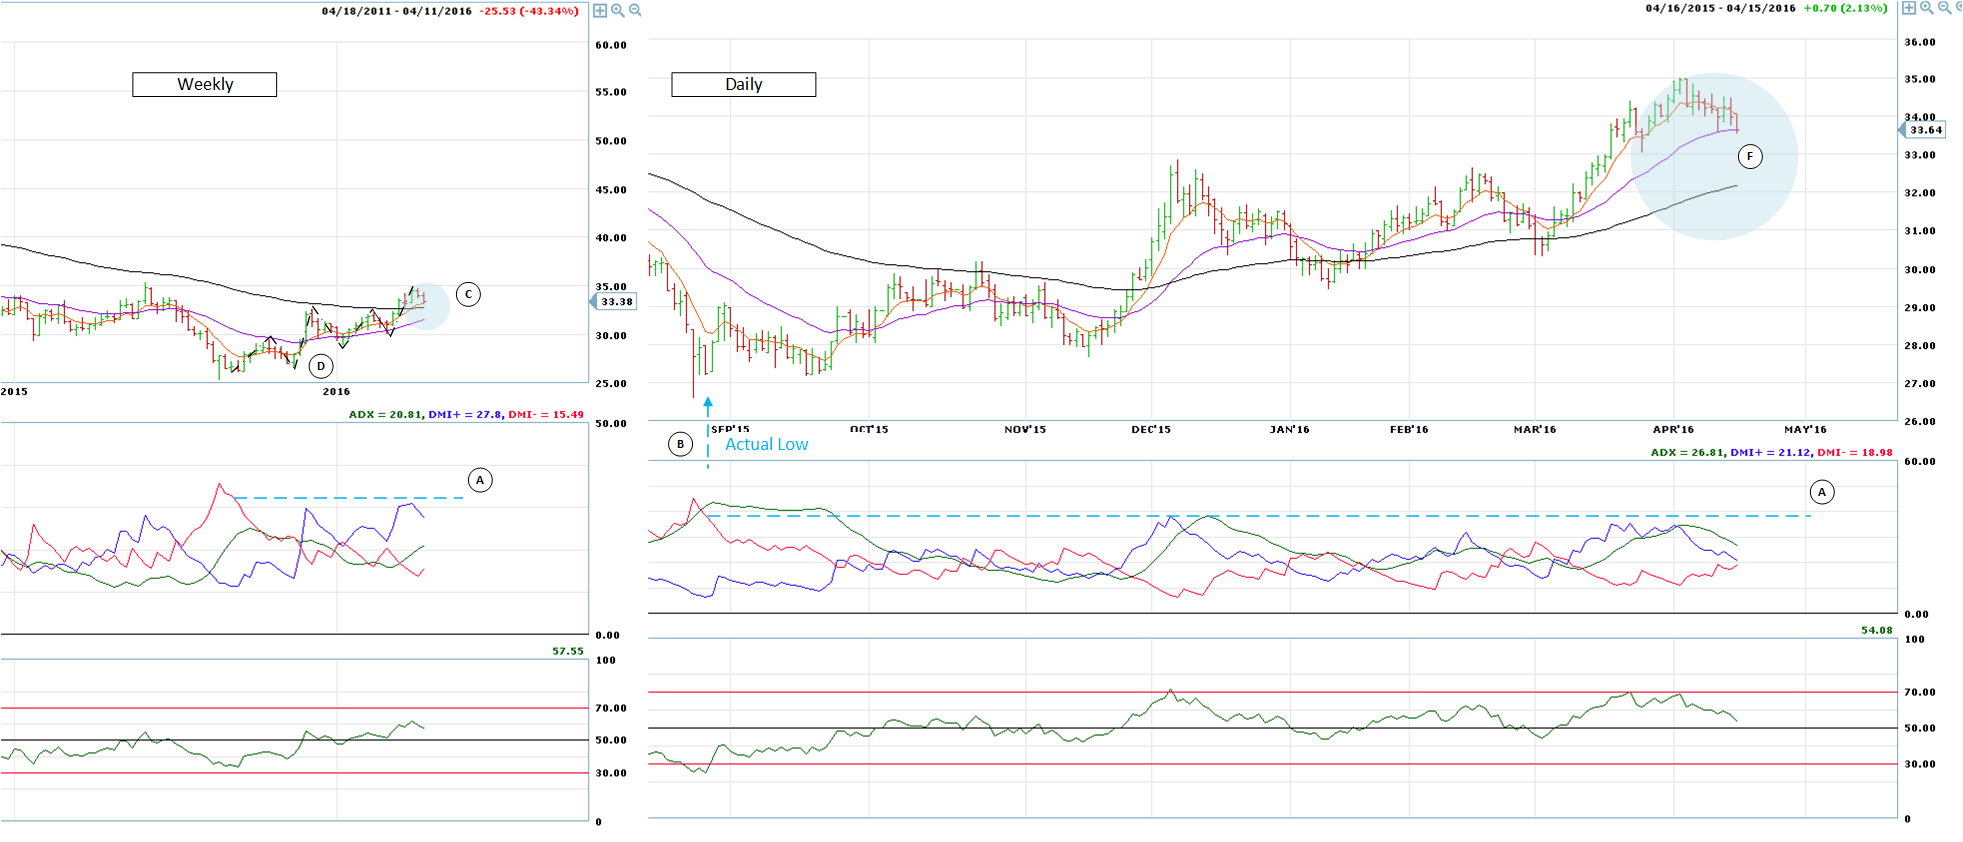
I’ll start with soybean oil as it is currently providing the most interesting chart. As of now, it looks like bean oil has been the leader of the complex. There are some interesting characteristics of both its price and indicators that may help draw some conclusions as to what the market’s next move will be.
(A) & (B) On both the weekly and daily charts, the +DI has failed to take out the -DI that corresponds to the low price put in place in September ’15. This is important because, as I interpret the ADX, this implies that the price movement since September has been a correction and not a change in trend. With this being a correction, there is the potential for further movement to the downside that could challenge the September lows if not exceed them.
(C) Price, on the weekly chart, has managed to penetrate resistance of the 90P EMA. The 26P EMA is still below the 90P so there is a possibility that the 90P may still hold. As the price has moved above the resistance, time will need to determine if it becomes sufficient support.
(D) The weekly price action has resembled more of a correction and not a series of smaller impulse waves making up a new uptrend. A potential wave count on the movement to-date could be something like an a-b-c-x-a-b-c with the last ‘c’ concluding 2 weeks ago. Now, if this is an appropriate count, then what is the next move? Either the market can begin to turn down and the current correction starting since September ’15 is over or another ‘x’ can be put in place with a follow-on a-b-c.
(E) Price on the daily chart has settled back to the 26P EMA. What happens this week can provide insight as to what may unfold in regard to (D) above. This applies to the weekly chart too. As price has begun to pull back, so has the 21P RSI and the daily ADX. The weekly +/-DI have nice separation with the ADX approaching 20.
What to watch:
On the daily chart, watch for price against the 26P EMA. If price pushes off this support and moves above 35, then a pullback could be a place to enter long. This type of price movement may negate the correction pattern discussed above.
Should the daily price break below the 26P EMA, watch for the 90P EMA to hold. In this scenario, it is possible for price, on the weekly chart, to drop below the 90P EMA and find support on the 26P EMA.
In either case, watch the 21P RSI on both the weekly and daily charts to provide support at the 50 range. Should the RSI and EMAs provide support for price over the next several weeks, it could be possible that there is another a-b-c in store as part of the September ’15 correction.
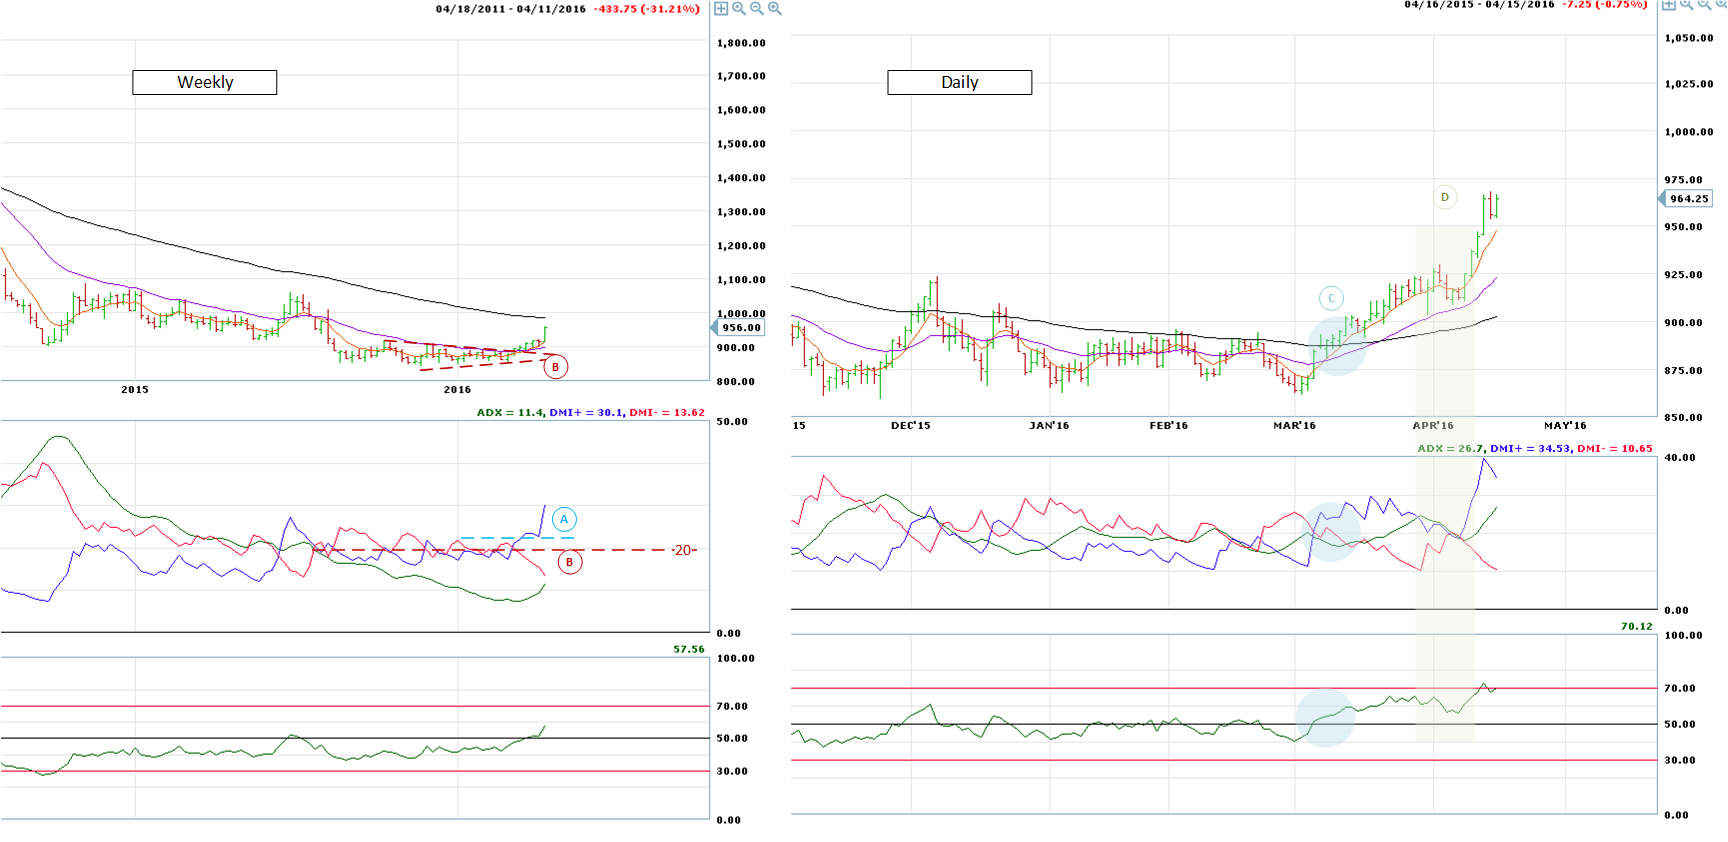
This past week has seen soybean meal break through daily resistance in an impressive fashion. It is unclear if this initial up move is ready to correct but time will make this clearer.
(A) On the weekly chart, the -DI reached during the low put in earlier this year is still intact (but barely). Though, the recovery of the +DI to bring it closer to this -DI level in a one-week period is impressive.
(B) The EMA’s on the weekly chart have yet to cross even though price has pushed through the 7P and 26P EMAs.
The weekly 21P RSI has just reached 50.
(C) On the daily chart, the ADX is telling a different tale than the weekly chart. On the daily chart, the +DI has decisively taken out the -DI that corresponds to the March low. Additionally, the ADX has moved above 20 and the 21P RSI has reached 70 indicating a potential top or the end of the week’s up move. There is no hard set rule that this indicator can’t move above 70 but just that 70 is a good place to begin to take partial profits. With these daily indicators turning positive so quickly and the ADX with +/-DI indicating a change in trend, it’s possible that this will be a leading indicator that the weekly chart will follow in the next several weeks.
(D) Price has exploded above the 3 EMA’s. The 7P EMA is well above the 90P but the 26P has not crossed over the 90P EMA. This week’s price action will help add some clarity as to the 26P EMA next move.
What to watch:
It is not clear what this market’s long term plans are yet. An interpretation could be that the price movement since March ’16 is that of a correction. If you’re not in the market, you should stand aside until there is more clarity. What’s really intriguing is the similarity of price action between this chart starting march 2016 compared to Soybean Oil between September and December 2015. One of the key differences is that the daily chart’s ADX for meal has signaled a change in trend (though this could just be short term) and the soybean oil chart never gave this signal (neither weekly or daily).
Watch price on the weekly chart as it approaches the 90P EMA. Should it find some resistance here, look for a pull back into the 26P EMA and the 21P RSI pull back to 50. If this scenario plays out, a price move up will be a place to take long position.
Soybeans 
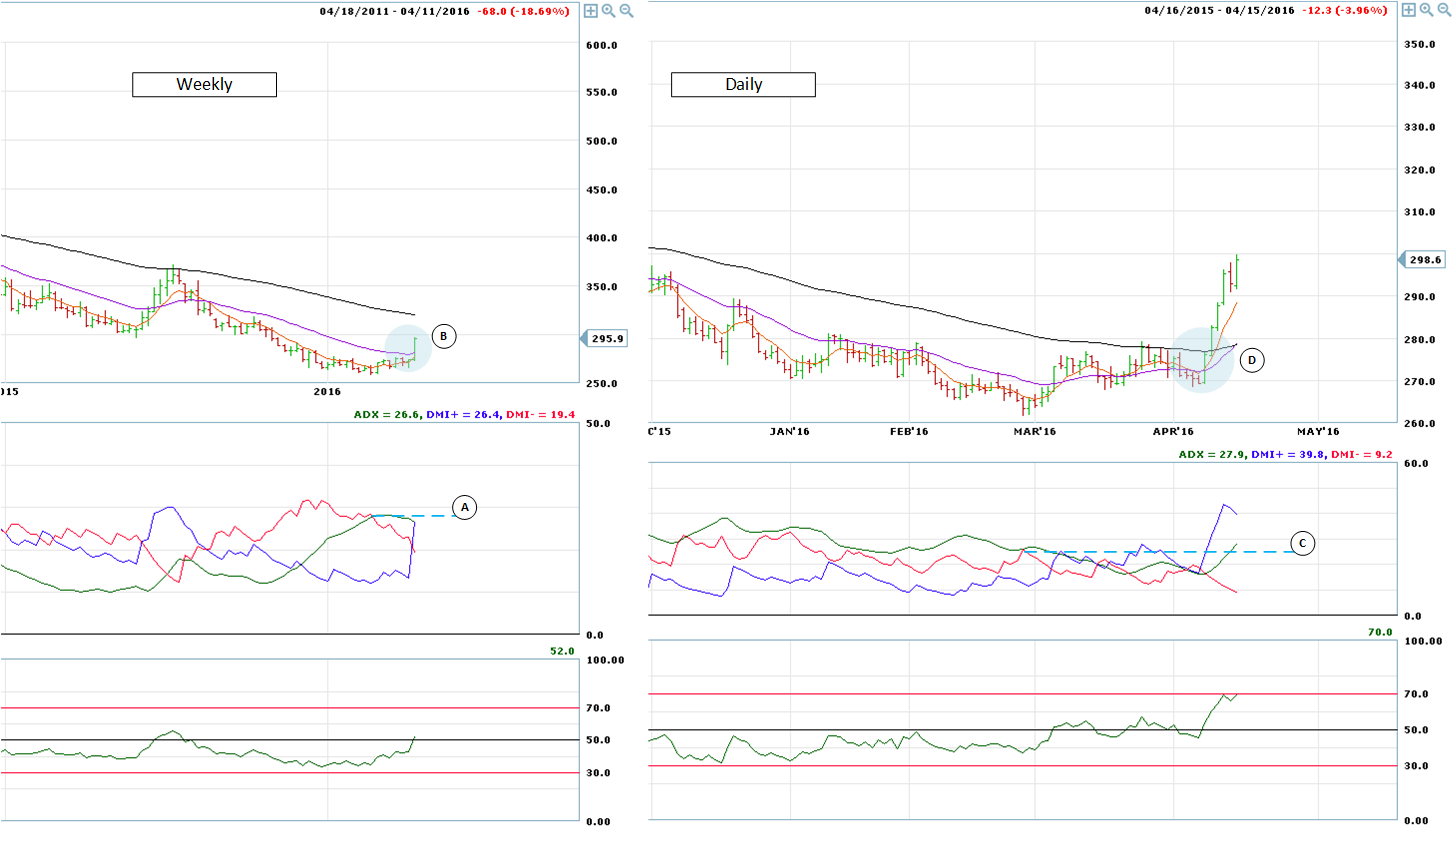
(A) On the weekly chart, the +DI has taken out the -DI that corresponds to the low put in toward the end of 2015. In conjunction to this, the 21P RSI has broken above 50. The ADX is still well below 20 but is now moving up in the right direction to signal that the current trend is strengthening.
(B) For the past year, the ADX has tracked below both the +/-DI and 20 setting up the price consolidation that has occurred. With a tight set of trend lines forming on price, the current breakout has pushed quickly up and toward the 90P EMA which may form the first real resistance.
(C) & (D) On the daily charts, price moved up over the 7P, 26P, and 90P EMA along with the +DI crossing over the -DI and the ADX turning up. After the initial push up (C), price pulled back and found support on the 26P EMA along with the 21P RSI pulling back to the 55 range (D).
What to watch:
Watch price on the weekly chart as it approaches the 90P EMA. Should it find some resistance here, look for a pull back into the 26P EMA and the 21P RSI pull back to 50. If this scenario plays out, a price move up will be a place to take long position.

