Forty Year Trading Range: $41.50 to $337.50 per lb.
Trades on the ICE from 2:30 a.m. to 1:00 p.m. CST
The International Coffee Association forecasts world coffee production for 2011-2012 at 128.6 million 60 kilo bags. That’s a decrease of 3.4 percent from the 133.1 million bags produced during the 2010-2011 crop year. There is a great deal of concern that the world’s supply of coffee could become exceptionally tight and terribly expensive to boot. Extensive programs are being put in place worldwide to insure sustainability of it’s coffee crops.
Brazil’s domestic coffee consumption is poised to overtake the United States within just a few years. The take away is that the more coffee consumed by locals the less there is available for export. Increasing wealth is driving Brazilians to cappuccinos and espressos. This is just one example. Coffee drinking is on the rise in the majority of the worlds developing economies. That’s spelled A-s-i-a! There is only so much land available for coffee cultivation. Someday, be it sooner or later, you may have to make it through the day without those cups of java!
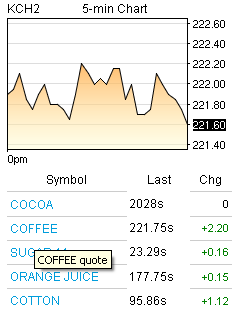
Weekly technical indications on Friday, January 6th: At this time the week’s trading range was 229.15-217.55, the last print is 219.90. The stochastic is in buy mode. At 39.57 the RSI is lower than last week’s reading of 42.46. The M.A.C.D. histogram reads -1.68, a bit higher than last week’s indication of -1.85. Again the week’s high pierced the 9 bar moving average, but fell back and is now trading below it. A weekly close at or below 214.80 in March coffee will turn the weekly trend down.
COCOA
Forty Year Trading Range: $4.44 to $53.79 per tonne
Trades on the ICE from 3:00 a.m. to 1:00 p.m. CST
West Africa’s record breaking 2010-2011 cocoa crop produced a large supply surplus. Yet another record breaking crop is expected following the 2011-2012 harvest. There is plenty of cocoa supply for now. But the not too distant future could bring extreme tightness to the world’s cocoa supply.
World cocoa supply is more than ample at this time, but what does the future hold? Chinese chocolate lovers consume just 3 grams per year. Add one chocolate bar to their yearly intake and the world’s cocoa supply would swing from one of plentiful supply to one of huge deficit. Forget about lower chocolate prices.
Asian tastes are becoming progressively more westernized. It wouldn’t surprise me to see cocoa prices move higher in 2012. Quite a few governments have put sustainability programs to work. Many of these programs are supported financially by the cocoa industry. Hopefully it’s not too late. Are $10.00 chocolate bars in our future?
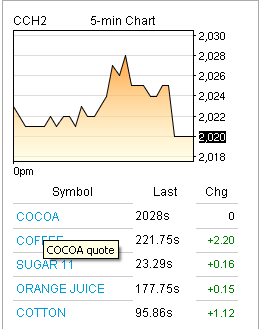
Weekly technical indications for Friday, January 6th: At this time the week’s trading range was 21.79-20.03, the last print is 20.47. The stochastic is in buy mode. RSI at 28.56 is a bit lower than last week’s reading of 29.95. The M.A.C.D. histogram at -49.26 is higher than last week’s reading of -55.36. The week’s trading activity was again between the 9 bar moving average and lower Bollinger band. A weekly close at or below 20.31 in March cocoa futures will turn the weekly trend down.
COTTON
Forty Year Trading Range: $26.84 to $227.00 per lb.
Trades on the ICE from 8:00 p.m. to 1:30 p.m. CST (Next Day)
The Cotton market is in the midst of a perfect storm; large supply coupled with minimal demand. Cotton spinning mills are sitting idle; and cotton merchants doing a minute amount of business. The cotton industry is smarting as a whole.
China has initiated a price support program for the country’s cotton farmers. So far the China National Cotton Reserves Corporation has purchased 1.43 million tonnes of domestically grown cotton. The company’s storage facilities can hold 4.1 million tonnes of the soft and fluffy.
Cotton rallied to post Civil War highs in 2011. After which the market reversed and headed lower with a vengeance. The sovereign debt crises in Europe led to a worldwide economic slowdown and hobbled recovery. Unless the macroeconomic picture improves, cotton prices will likely hold steady in 2012.
Weather events could change the scenario in a heartbeat. As of now it appears that cotton will be pushed aside by more profitable crops in 2012. A sizable amount of acreage once devoted to cotton is expected to be planted with soybeans and corn. Raising cotton requires much more attention and strict insect and weed control. Overall, cotton is an expensive crop to grow.
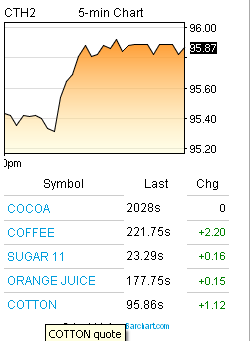
Weekly technical indications for Friday, January 6th: At this time the week’s trading range was 96.48-91.85, the last print is 94.90. The stochastic is in buy mode. RSI at 46.53 is higher than last week’s reading of 42.46. The M.A.C.D. histogram at -0.17 is higher than last week’s indication of -0.79. The majority of this week’s trade took place above the 9 bar moving average. It’s been eight weeks since we’ve seen that. This week cotton rallied to just below the center Bollinger band. I continue to expect surprises to be on the upside. A weekly close at or below 88.00 in March Cotton will turn the weekly trend down.
SUGAR
Forty Year Trading Range: 2.30 cents to 66.00 cents per lb.
Trades on the ICE from 2:30 a.m. to 1:00 p.m. CST
Talk is that the world’s sugar surplus for 2011-2012 is expected fall 11 percent to 8.2 million tonnes. Presently there is more than enough sugar supply to satisfy demand. One thing to keep in mind is that lower sugar prices will divert additional Brazilian sugar to ethanol production. World ending stocks are expected to surge near 27 percent following this growing season.
China is “THE” major player in the sugar market. Sugar auctions had been held there to cool inflation and add to the available supply. The country has been importing sugar to replenish state reserves and meet demand. Expect China to be a strong buyer of sugar in 2012. Following this season’s harvest India became a net exporter of sugar. The food ministry has approved the export of one million tonnes of sugar thus far.
Sugar cane is exceptionally temperamental. Major rain in the world’s sugar growing areas is bad news for sugar. Too much rain and the sugar content in the cane drops precipitously. Also, much of the sugar cane is very old and beyond it’s prime production years. It is in need of replacement.
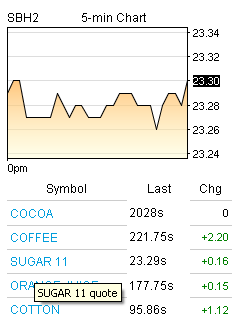
Weekly technical indications for Friday, January 6th: At this time the week’s trading range is 24.65-22.90, the last print is 23.35. The stochastic is in buy mode. RSI at 42.89 is higher than last week’s indication of 42.63. The M.A.C.D. histogram at -0.30 is higher than last week’s reading of -0.40. The market rallied sharply on Tuesday and traded to the week’s high on Wednesday. Sellers then arrived and drove the market to the bottom of it’s now seven week old trading range. A weekly close at or above 23.91 in March Sugar will turn the weekly trend up. 