There’s no consensus on whether silver is in its second or third secular bull market since the 1970s. That’s because people define bull markets in different ways.
But as I’ll show you, it’s not that important.
What we do know is that silver enjoyed a huge bull market from about 1971 until 1980, and then another major bull run from about 2001 until 2011.
Most secular bull markets run through a period, usually about half-ways on the time scale, where the commodity’s price falls by about 50%, sometimes more. This is an observation by the legendary commodities investor Jim Rogers.
In my own experience that’s, in fact, often the case, although sometimes the price correction is less severe if it’s drawn out over a longer time. Corrections are typically short and deep, or long and shallow. There is no rule, and it’s never the same.
Let’s dig into these previous bull markets to give us an idea of how silver has behaved. This will provide somewhat of a roadmap for what may lie ahead. Spoiler alert: Looking back on how silver performed in the past points to much bigger gains ahead.
Past Is Prologue: Silver Bull Markets
In the 1970s silver rose from a low near $1.40 in 1971 to peak at $49 in 1980. That produced a whopping 36 times return, or 3,600%. Every $1,000 became $36,000.
Then, silver eventually bottomed in 2001 at $4.20, before rising all the way back to $49 in 2011. Investors who had positioned themselves early enjoyed a 1,160% return.
Now, let’s dissect both of these bull markets in more detail, because understanding how they behave can help you better prepare. As you’ll see, silver is volatile. But if you want to benefit from its big gains, you have to be willing to hold on through what is sometimes a wild ride.
As I said, silver bottomed near $1.31 in October 1971. That’s when its 1970s secular bull market began.
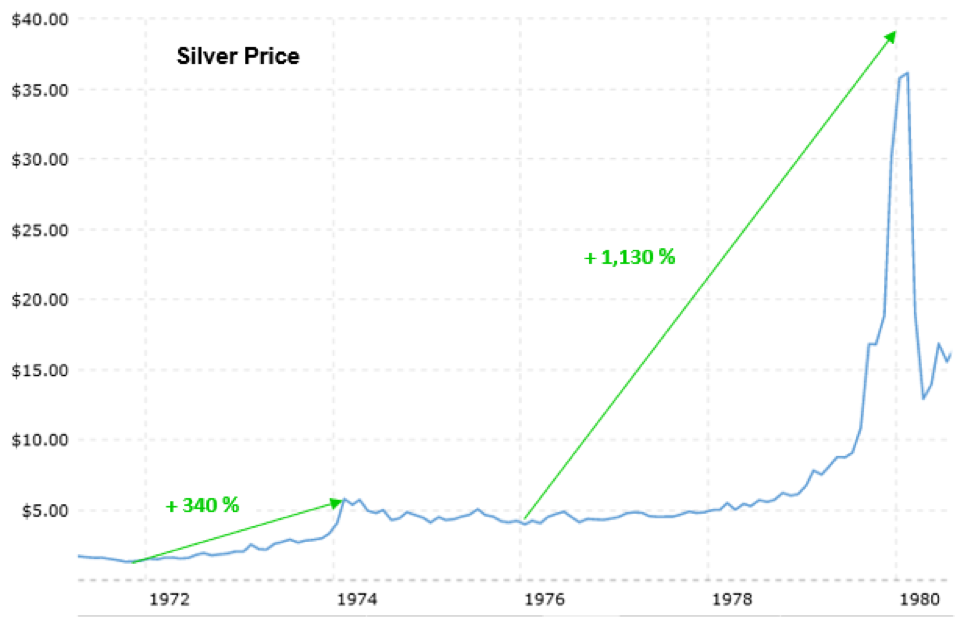
It then peaked at $5.78 in February 1974. That was a 340% gain in less than 3½ years. But then silver started to lose ground.
That correction took it from $5.78 to $3.97 in January 1976. It was a relatively shallow, but drawn-out correction. By October 1978 silver had surpassed $5.78, and eventually went onto a blow off mania high near $49 in January 1980, gaining 1,130% from its 1976 low. (Note: The $49 high in 1980 doesn’t appear in this chart because it shows monthly prices.)
Silver’s gain from the 1971 low of $1.31 to its $49, 1980 high was an astounding 3,640%.
Two decades later, it would do something similar – again.
In November 2001, silver bottomed at $4.14. No one was paying attention, and no one wanted it. Silver was the perfect contrarian trade. It then launched into a new bull market, rising to $19.89 by February 2008, producing a 380% gain.
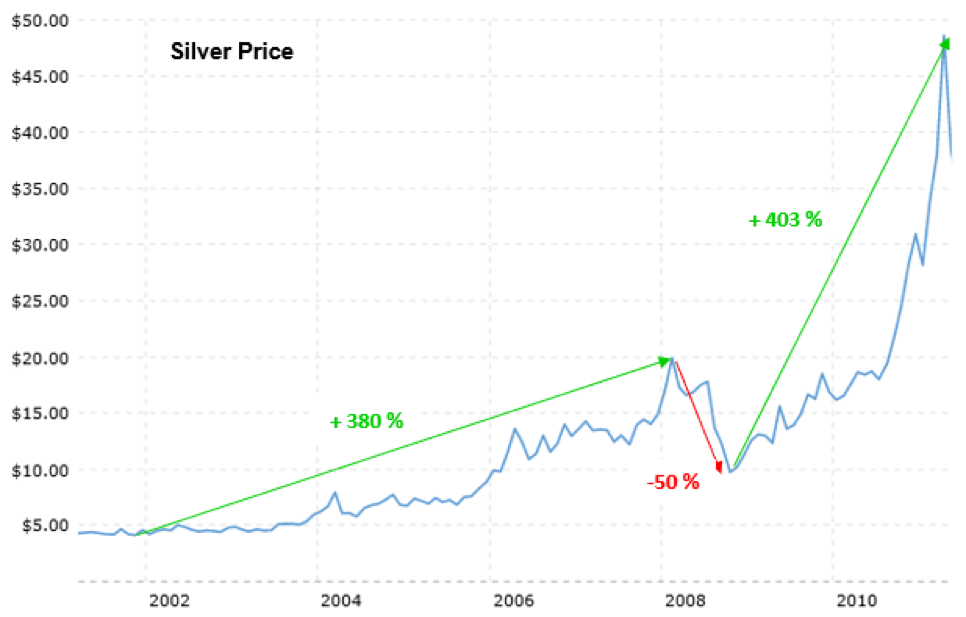
Silver then corrected from $19.89 to $9.73 in October 2008, putting in a relatively short but sharp 50% correction. It then went on to climb all the way to $49, reaching that level in April 2011, for a 403% gain from its 2008 low.
But during its decade-long run that started in 2001 up to its peak in 2011, silver gained 1,080%. That’s a tenfold gain.
Prepare For Silver Corrections
Silver is volatile. There’s no denying it. But that’s also part of its appeal.
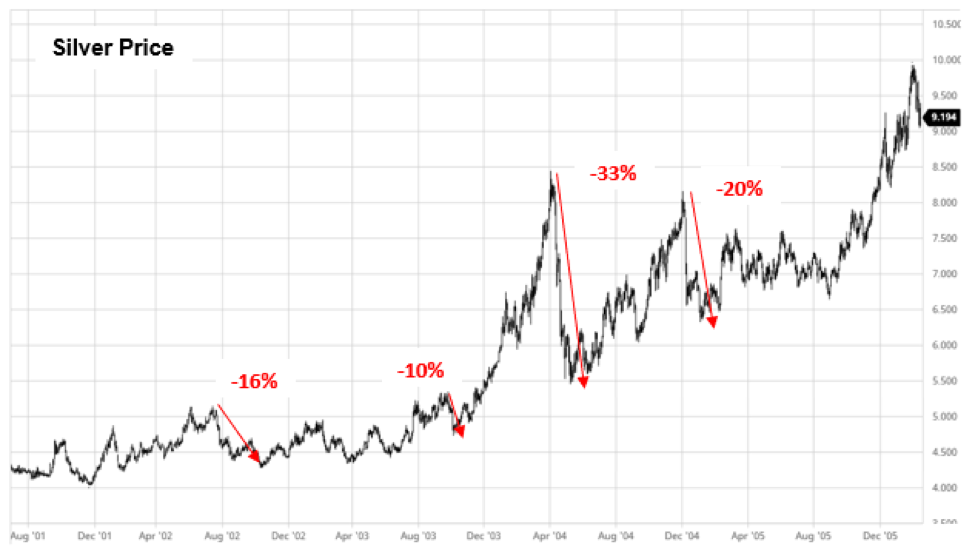
Between 2002 and 2006, silver dropped 10% or more four separate times.
Then, between 2006 and 2011, more short but sometimes deep corrections came, with silver dropping 13% or more three times.
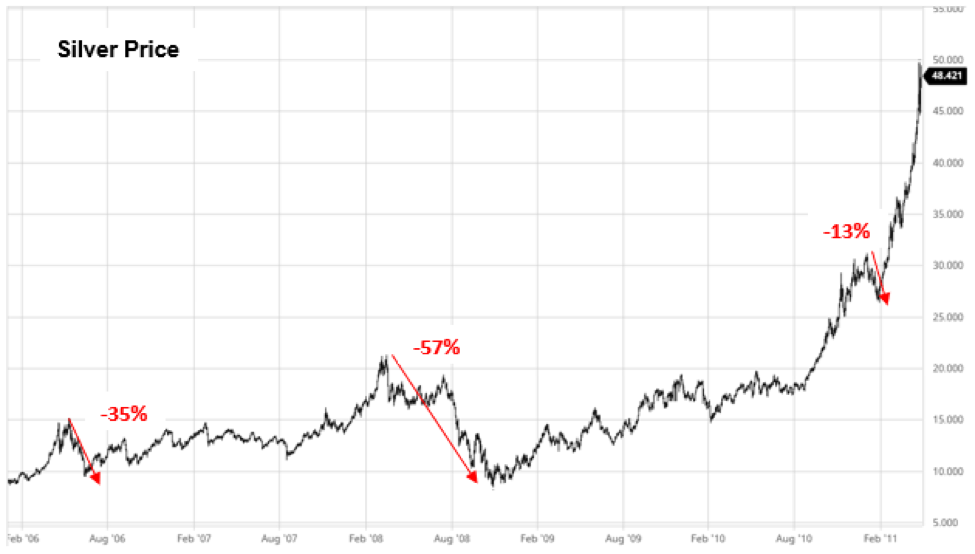
Overall, from 2001 until its peak in 2011, silver gave back 20% or more four times. But the real takeaway is that anyone who held on from the beginning enjoyed an astounding 1,080% gain.
And one final point to consider; silver stocks offer tremendous leverage to silver itself.
This chart compares the performance of iShares Silver Trust (NYSE:SLV), a silver ETF that mimics the price of silver, with SIL, a silver ETF made up of mostly large silver miners. The chart runs from mid-January to early August 2016.
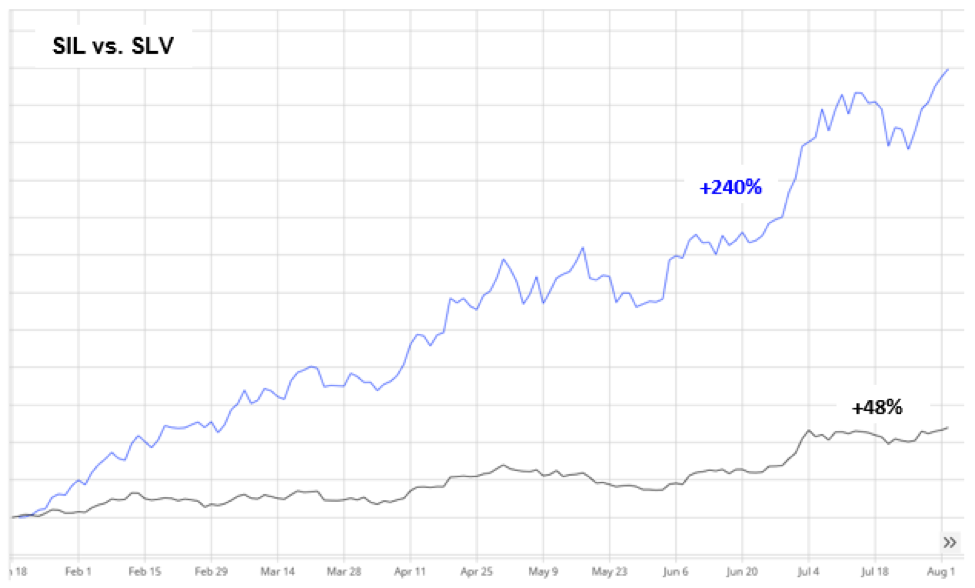
The black line is SLV and the blue line is SIL. During this six-month period, SIL was up 240%, dramatically outperforming SLV which gained a very respectable 48%. Silver stocks were up by five times as much as silver itself in just six months.
That’s why I want to own silver stocks, as well as silver itself. The leverage can be tremendous.
Where Silver Stands Today
Given the extreme and unprecedented levels of stimulus, money-printing and debt in the last few decades, my view is that we are still in the midst of the silver bull market which started in 2001.
I think silver’s bull could run for a total of about 25 years starting from 2001. With that in mind, we could have another 5-6 years in front of us, maybe more.
From silver’s $49 peak in 2011 to its $12 bottom this past March, silver lost 75%.
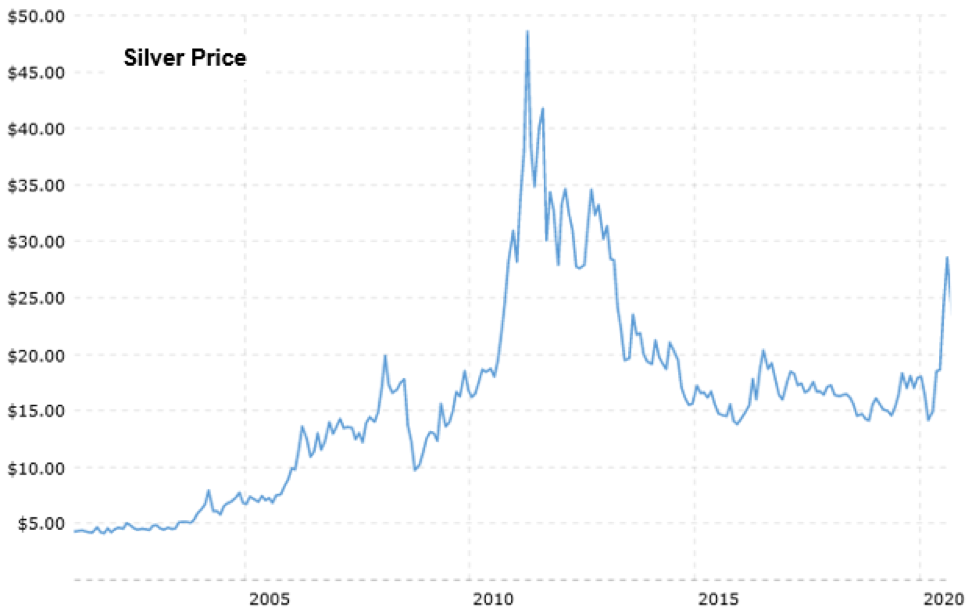
The fact that silver bottomed at $12, which was almost triple the $4.14 low in 2001, suggests to me that we are still in the same powerful multi-decade bull market.
My target price over the next few years is for silver to reach at least $300. How I reach that number is a topic for a future article. But before you think I’m crazy, I can assure you that it’s an estimate relating to the gold price, and based on how gold and silver have performed in previous bull markets.
If silver reaches my target of $300, that will be a 1,150% return from its current price near $25.
While that’s a tremendous return, you need to expect volatility and future corrections. But you’ll only benefit if you’re willing to stay the course. There will be opportunities to lock in profits along the way, especially in silver stocks, but you need to have a core position you’re willing to hold through corrections for maximum gains.
I’ve written a detailed Silver Report explaining why silver has tremendous upside, and is heading much higher in the years ahead. In it I cover both the demand and supply side dynamics for silver, showing why the metal is fundamentally still very cheap, but how the outsized opportunity is in explosive silver stocks.
Bull markets do their best to bring along the fewest participants. Just don’t let the silver bull shake you off.
Disclosure: I own shares in SIL.
