High blood pressure is widely known as “the silent killer” for good reason. This post is a continuation of our post from early August on liquidity in the bond markets.
As an RIA managing individual investor money and reading more about liquidity risk in the fixed income markets, today I’m wondering if moving clients' fixed-income to predominantly a cash / municipal strategy isn’t the right approach at this point as taper ends.
Despite the weekly August employment report last week, Fed Governor testimony seems to have become progressively more hawkish. Seriously, only Janet Yellen’s opinion matters in terms of the timing and degree of rate hikes, but despite little indication of an acceleration in the various inflation measures, the drumbeat grows for “normalizing” interest rates.
Is the end of QE3 and the end of taper impacting liquidity in the bond markets? Could be. I think “quantifying or measuring liquidity,” or lack thereof, is difficult, particularly at the retail level, and even the bigger firms might try to measure it, but there has to be a degree of uncertainty around all of it. As one Supreme Court Justice once said around adult entertainment, “I can’t define it, but I know it when I see it.”
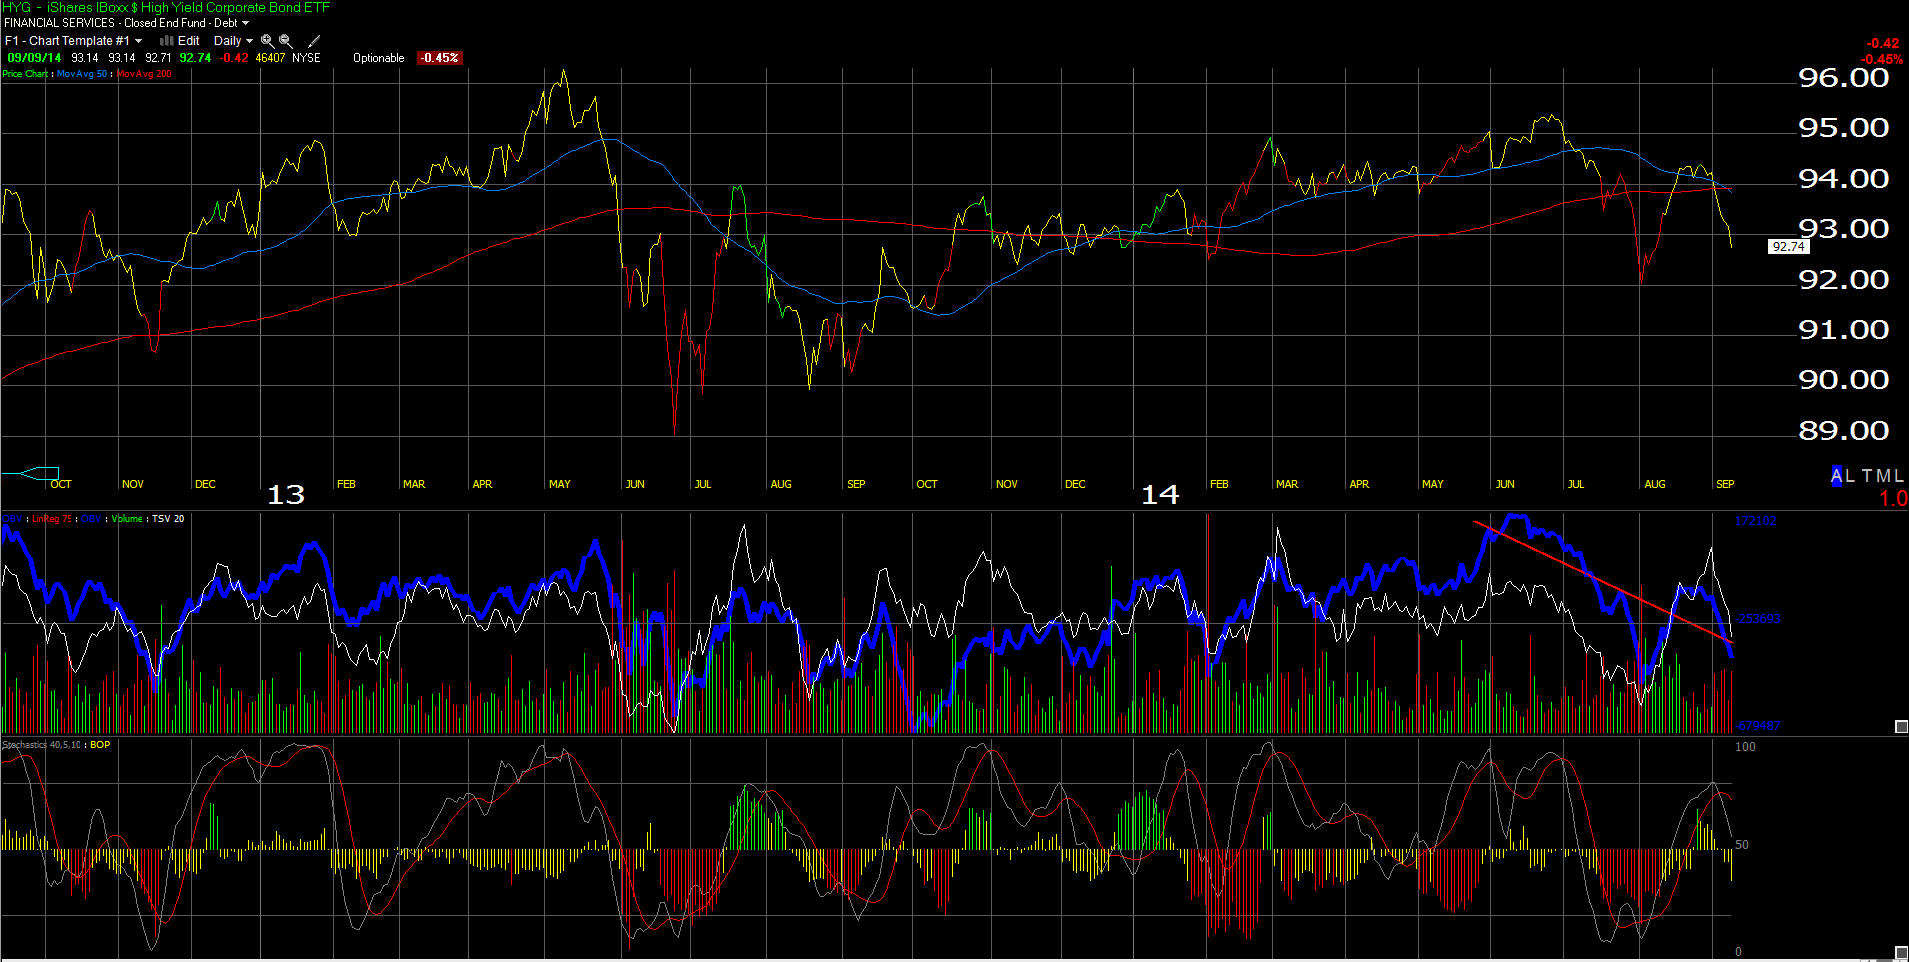
Here is the point of all this: May ’13, when Fed Chair Ben Bernanke first announced the taper, and then again in late July/early August ’14, the taxable high yield market, as evidenced by the iShares High Yield Corporate Bond Fund (ARCA:HYG) (a taxable corporate high yield ETF) hit two sizable air pockets where the bottom just fell out.
In 2013, it suffered a 7% drop in a little over 6 weeks, as the HYG fell from a little over $96 to $89 in that time period. The drop in 2008 was far greater in absolute terms, from $100 in early May ’08 to $65 by December ’08 or roughly 35% in total, but a 7% drop in 6 weeks, if allowed to continue, seems equivalent to a 35% drop over a 7 month time frame.
A long-time friend and former colleague runs a $2 billion taxable portfolio here in Chicago. I asked this individual for their comments about liquidity (understandably, this person and the firm would prefer anonymity ). Also BlackRock did an excellent whitepaper on the topic in June ’14 which they sent to me for usage and attribution. Here is a quick highlight of the BlackRock whitepaper’s important points (as I see them):
- Trading liquidity has been on a downward slope;
- Market liquidity, particularly in corporate bonds, has declined since the Financial Crisis in 2008. BlackRock called the situation in corporate bonds “challenging”;
- Because of regulation and the requirement to hold more capital against these “risk” activities, traditional liquidity providers such as banks and dealers (not sure if BlackRock is alluding to broker / dealers) “have pulled in their horns” in terms of providing secondary trading liquidity to the markets;
- While outstanding corporate debt has jumped 77% to $9.8 trillion in the 7 years ending 2013, perhaps in the market’s attempt to fill the liquidity gap, electronic trading of corporate bonds has more than doubled since 2009. Per the BlackRock paper, this is still less than 14% of total turnover as of the end of 2013. The BlackRock paper did not give the growth rate of the electronic trading levels;
- The BlackRock paper also discussed equity liquidity but we’d prefer not to address that issue or its components at this time;
Comments from the taxable PM:
- Liquidity is a big issue in all the markets currently;
- Liquidity in high grade is decent but it quickly evaporates in tough environments as dealers have significantly reduced the amount of capital they are committing to positioning bonds ( supports the BlackRock conclusions);
- Liquidity in high yield is an issue, not just in the way down, but also on the way up. This summer’s selloff was probably half fundamental (Ukraine) and half illiquidity. This individual thinks that the 2013 decline was mostly liquidity driven, which makes sense from my perspective, given the economic data was still on upward sloping trajectory;
Intuitively, fewer participants, more risk aversion, and unattractive absolute yields might make any market illiquid.
The scary part of all this is that all institutional participants seem to be acting in unison. If all the major players try and exit the market at once, where would this leave the individual investor or the small advisor ? (You can guess, I’m sure).
Although it will be the subject of a separate post, the municipal market might be a relatively “safer” place, than the corporate bond market, particularly if interest rates should rise sharply, and new issuance volume should evaporate.
Today, the Market Vectors HighYield Municipal ETF (ARCA:HYD) yields 5.32% (per Morningstar) while the HYG yields 5.70% (also per Morningstar).
A rapid rise in interest rates (which, like the arrival of Godot, has been waited on with baited breath since 2009) could be significant in terms of liquidity for the bond markets.
When I look at the taxable bond markets—since liquidity risk seems unquantifiable, or at least difficult to quantify in terms of “spread to Treasuries”—I have to ask, are absolute yields worth it today, particularly in high yield?
