Periodically on Scott’s Investments I analyze the technical picture for Gold and its corresponding ETF, GLD (SPDR Gold Shares ETF). Before I get to the technical picture, let’s look briefly at money supply and Gold’s long-term fundamentals.
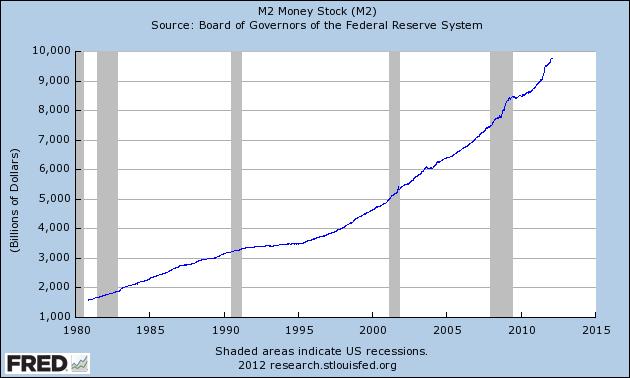
Gold can act as a hedge against quantitative easing and currency debasement because it is viewed as an alternative to fiat currencies. Looking at the chart below, courtesy of Chris Vermeulen via the St Louis Fed, we see the long-term expansion of M2 money supply is in a long-term uptrend:
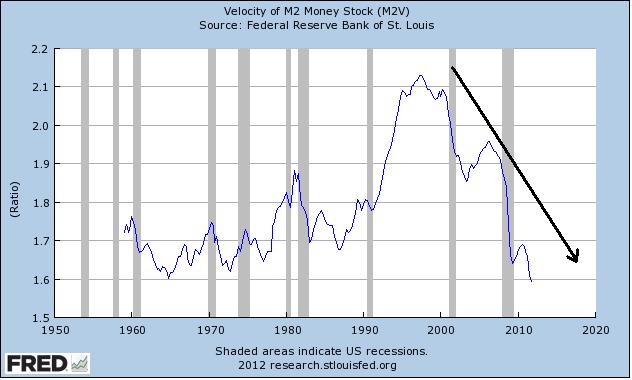
A decline in a velocity of M2 money stock as shown below tells us in simple terms that the M2 money supply is not turning over as quickly as it was at its peak in the mid 90s:
Vermeulen argues regarding gold and silver (SLV):
“the intermediate to longer term it is unlikely that we have seen the highs of this bull market for either metal. As long as central banks around the world continue to print money and expand their balance sheets, gold and silver will remain in a long-term bull market.”
I would tend to agree with the intermediate to long-term picture. Nothing goes up forever and it is important to remain flexible and open-minded as conditions change and new evidence presents itself. However I do not think the bull market in gold has run its course, especially with the Federal Reserve stating it will keep rates at low levels for the foreseeable future.
In the short-term we can use technical analysis to guide us. Gold and GLD struggled mightily in December but rebounded in January. With the strong sell-off in December Gold’s long-term uptrend looked to be in trouble, however the January rebound, albeit on lighter volume, staved off a complete breakdown. This trend has continued in February, with GLD up 12.52% year-to-date.
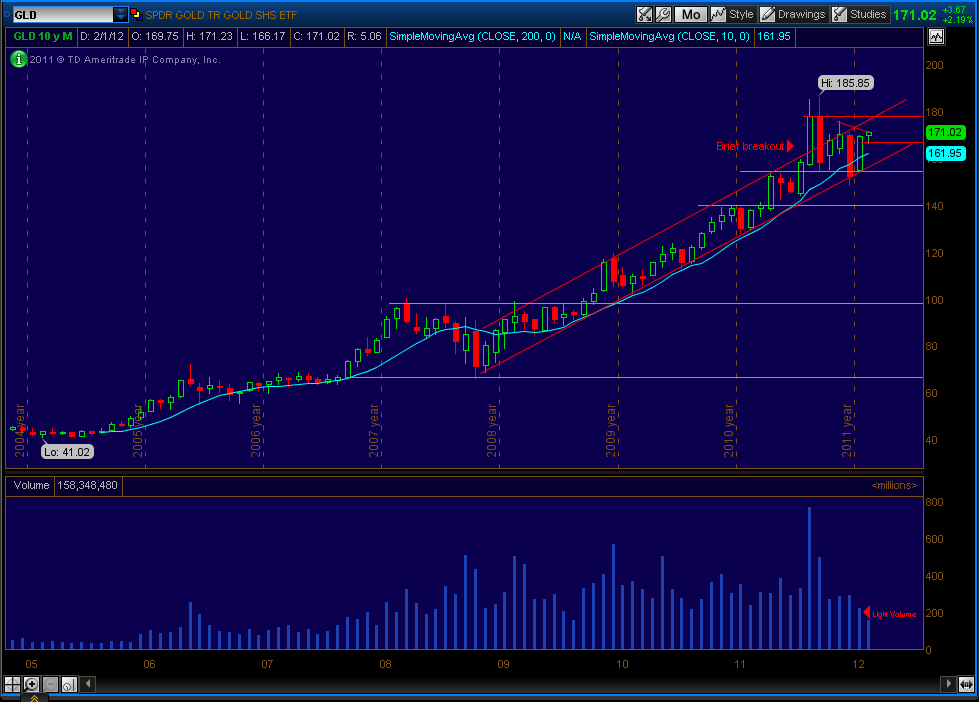
I continue to monitor the upward channel in GLD that began in 2008. Of note is the brief breakout of the channel in 2011, which resulted in a strong sell-off the subsequent month, bringing GLD back within the channel. In December 2011 there was a serious threat of a breakout below the channel, but GLD regained its footing in January and has gravitated closer to the top of the channel this month:
Since 2009 the 10 month simple moving average (in blue) has closely aligned itself with the bottom of the channel. GLD currently resides above the 10 month moving average, although the break below the 10 month SMA in December was the first significant break below the average since 2008.
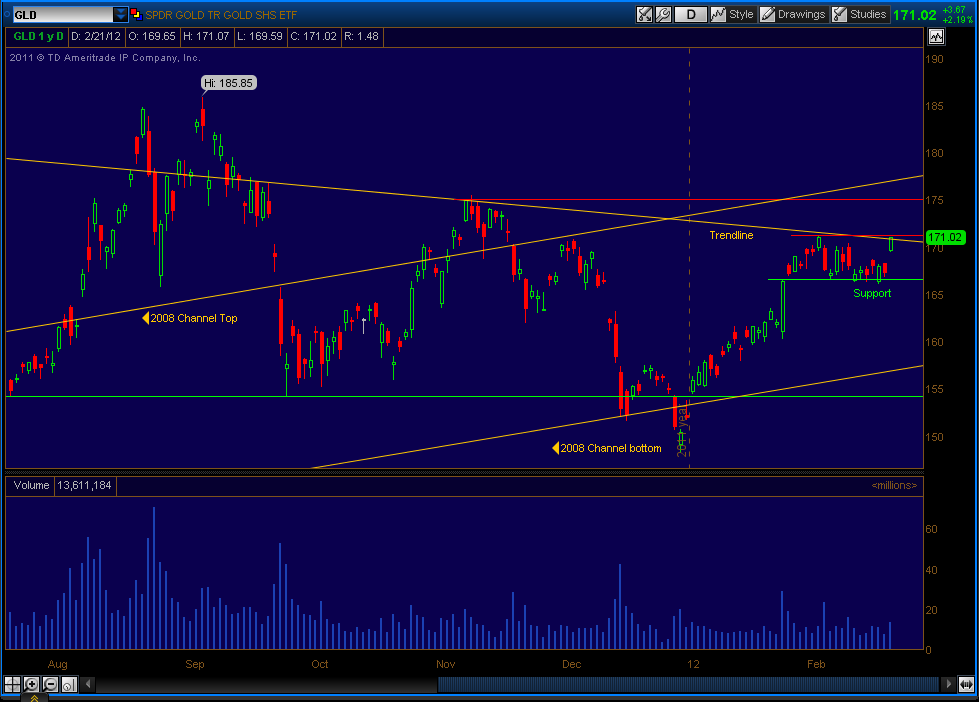
In the short-term, yesterday’s move in GLD was noteworthy and we could be near a short-term breakout depending on today’s action. February’s high is $171.23 and GLD is touching the trendline (yellow line) that includes February’s high. We actually closed just above this line yesterday (Tuesday), so today (Wednesday) we could be set for a higher move this week if resistance at $171.23 is broken. The next price target would be the resistance level (red line) around $175. Price support (green) in the daily chart is in the $166.50 – $166.60 range:
- English (UK)
- English (India)
- English (Canada)
- English (Australia)
- English (South Africa)
- English (Philippines)
- English (Nigeria)
- Deutsch
- Español (España)
- Español (México)
- Français
- Italiano
- Nederlands
- Português (Portugal)
- Polski
- Português (Brasil)
- Русский
- Türkçe
- العربية
- Ελληνικά
- Svenska
- Suomi
- עברית
- 日本語
- 한국어
- 简体中文
- 繁體中文
- Bahasa Indonesia
- Bahasa Melayu
- ไทย
- Tiếng Việt
- हिंदी
The Short and Long-Term Picture for Gold
Published 02/22/2012, 01:31 AM
Updated 07/09/2023, 06:31 AM
The Short and Long-Term Picture for Gold
Latest comments
Loading next article…
Install Our App
Risk Disclosure: Trading in financial instruments and/or cryptocurrencies involves high risks including the risk of losing some, or all, of your investment amount, and may not be suitable for all investors. Prices of cryptocurrencies are extremely volatile and may be affected by external factors such as financial, regulatory or political events. Trading on margin increases the financial risks.
Before deciding to trade in financial instrument or cryptocurrencies you should be fully informed of the risks and costs associated with trading the financial markets, carefully consider your investment objectives, level of experience, and risk appetite, and seek professional advice where needed.
Fusion Media would like to remind you that the data contained in this website is not necessarily real-time nor accurate. The data and prices on the website are not necessarily provided by any market or exchange, but may be provided by market makers, and so prices may not be accurate and may differ from the actual price at any given market, meaning prices are indicative and not appropriate for trading purposes. Fusion Media and any provider of the data contained in this website will not accept liability for any loss or damage as a result of your trading, or your reliance on the information contained within this website.
It is prohibited to use, store, reproduce, display, modify, transmit or distribute the data contained in this website without the explicit prior written permission of Fusion Media and/or the data provider. All intellectual property rights are reserved by the providers and/or the exchange providing the data contained in this website.
Fusion Media may be compensated by the advertisers that appear on the website, based on your interaction with the advertisements or advertisers.
© 2007-2025 - Fusion Media Limited. All Rights Reserved.
