By Argentus Maximus
I have noticed much discussion about this cycle in recent weeks. The narrative is that it is a religious reflection of the Sabbath principle, whereby six days are for work and the seventh is for rest. Apply this idea to a timescale of years and it becomes 6 years tilling the fields and the seventh year for allowing the land to go fallow and regenerate fertility.
A little searching will reveal that certain parts of the world take the Shmita "cycle" pretty seriously. Some connotations are that the seventh year should be interpreted as a year during which financial debts are cleared completely - a Debt Jubilee. The indebted part of the world could do with that I guess, but the part of the world that owns said debts would be more likely to respond with high velocity projectiles, explosives and assassinations of those adventurous persons who propose such ... revolutionary ... notions, and look like they are becoming increasingly heard by the masses.
So is there really a seven year cycle? What would it look like if there was? It's easy to take eg 2008, the stock market high and go back 7 years to 2001 and say "Look! The 911 attack happened then!". My simple response would be that 911 is possibly a connected event, but only possibly. Let's look back some more before jumping to possibly false conclusions.
Another 7 years prior was 1994 a time during which the bond market took a dive. But I have this nagging doubt still. Look at it this way, every year bad things happen and it's so easy to cherry pick newsy events to curve fit a theory. I need to see either more precision, or more duration of an increased number of repetitious sequences to become convinced.
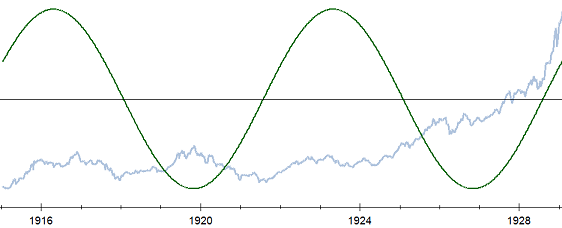
So with that in mind I went back to 1915 and walked forward 100 years to see how a 7 year alleged cycle corresponds with the price of the Dow Jones Industrial Average in stocks.
Readers are free to make up their own minds about what they see, or don't see. I provide the visual track record for your perusal. Oh also, this cycle has a test using the Bartels test of approximately 90% probability of being non random in timing and fit of it's wave structure.
I tracked it back to 1865 but decided to show the last 100 years for this contribution.

Above: The 1910s and roaring 20s and seven year cycle in the Dow.

Above: The 1929 crash, 1930s and 40s depression years and the seven year cycle in the Dow.

Above: The post WWII depression period from 1945 to 1965 and the seven year cycle

Above: The 1970s stagflationary depression and the early 1980 inflationary breakout for the Dow with the 7 Year cycle

Above: The 1980s, 1987 crash, and 1990s and the seven year cycle in Dow stocks

Above: The "naughties" and "teens and seven year cycle in the DJIA
The above chart shows what might happen in this alleged cycle actually exists, and continues it's merry way for the coming six years.
Of course those of us who are politically aligned might point to a 7.5 to 8.5 year cycle which could occur when two presidency terms within the US, Japan or elsewhere are filled consecutively by the same individual, a like-thinking sequence of individuals (such as in communist countries, a "chosen" replacement candidate) or when two business cycles are joined together in a pairing. Many countries choose political leaders such as they are able to, at 3 1/2 to 4 year intervals, and therefore two terms together makes up the required time. So the Sabbath is a nice idea, and it goes back a long time for sure, but I merely point out to readers that the self organized structure of mankind in many places on the planet allows for semi repetitious performance, whether to good or bad effect, for other reasons too. Choose your cause if you need to.
Before signing off, take another look at those charts above. Did you notice a tendency to go down for only 1/4 of the 7 years and to go sideways and up for the other 3/4s? If this cycle is real, that tendency might be real too.
So ... if it doesn't bottom at the half way point, could this exercise just be looking at pairs of three and a half year cycles? It might well be so. If it were so, then the lows in the seven year idealized sine wave might look like highs instead of lows, and the actual lows would appear at the times when the sine wave crosses it's midpoint, or centre of trading range. Possibly this happens sometimes but not all the time and both cycles can be seen doing their thing.
You've got to decide some things for yourself, especially when the information available is partial and subjective, rather than enough to constitute proof. I think there is enough information here to work with, or make a good start into a more detailed investigation, should that be deemed necessary.
