
Employment – initial claims dropped 13k to 263k (’73 level), year over year trend: receding (job cuts year over year trend: advancing)
Housing – mortgage applications had the 2nd largest week over week gain since ’09 most likely due to an upcoming regulatory change
Services – Services PMI dropped to 55.1, year over year trend: receding, ISM Services dropped to 56.9, year over year trend: flat
Inventories to Sales – wholesale inventories rose the most in 7 months, 0.1% MoM, year over year trend: advancing, sales dropped the least in 7 months, 1.0% MoM, year over year trend: receding, overall ratio is recessionary
Q3 GDP Forecast – 1.0%, year over year trend: receding
Employment
Initial claims dropped 13k to 263k – just shy of the lowest levels since ’73…

However, since QE3 ended job cuts have been trending higher and have already surpassed last year’s total with the highest annual total since ’09.

Is the labor market really that healthy as many say it is?
 Housing
Mortgage applications for new home purchases and refinancing had the 2nd largest week over week gain since ’09.

The reason is believed to be attributable to an upcoming regulatory change (TILA-RESPA).
Services
Services PMI dropped to 55.1 (missing expectations of 55.6) and near the June low.
Additionally, after jumping to a year high in July, ISM Services dropped to 56.9 (missing expectations).
Services PMI (blue) now appear to be trending down with Manufacturing (red) …

Wholesale Inventories to Sales
Wholesale Inventories rose the most in 7 months, 0.1% MoM and Sales dropped the least in 7 months, 1.0% MoM.
However, the inventories to sales ratio at 1.31x is now at recessionary levels.

With inventories up 4.2% YoY and Sales down 4.5% YoY, the trade gap between inventories and sales has never been greater.

GDP Q3 Forecast
The Fed’s GDPNow model for real GDP growth (seasonally adjusted annual rate) in the third quarter of 2015 is 1.0%(down from 1.1% percent on October 6).

The change reflects the contribution of inventory investment to third-quarter real GDP growth which ticked down 0.1% to -2.1%.
Asset Allocation Summary
Major Asset Class Allocations – 5% Stocks, 75% Bonds, 20% Cash
Int’l Developed Stock Allocations – 1.25%– Italy/Germany
Int’l Emerging Stock Allocations – 1.25%– Mexico/Indonesia
Int’l Emerging – BRIC Stock Allocations – 2.5%– Brazil/Russia
US Bond Allocation – 62.5%
Int’l Developed Bond Allocation – 2.5%
Int’l Emerging Bond Allocation – 10%
Asset Class Trends (for new allocation commitments)
Int’l Developed Stock Trend – bearish
Int’l Emerging Stock Trend – bearish
US Bond Trend – neutral (previously bearish)
Int’l Developed Bond Trend – neutral (previously bearish)
Int’l Emerging Bond Trend – bearish
US Dollar– neutral
Euro– neutral
Emerging Markets Currencies– bearish
OVERALL RECOMMENDATION – hold existing allocations / no new allocation commitments
Country Stock Fundamentals – Market Cap/GDP ratios (October)
Int’l Emerging – BRIC offers the best opportunity based on their weighted Mkt Cap/GDP value to overall GDP weights across the globe.

Int’l Developed

Int’l Emerging

Int’l Emerging – BRIC

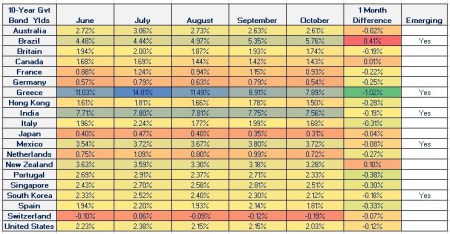
Yields
Bond yields are falling across almost all economies.
The one major exception is Brazil which is experiencing both political and economic turmoil.
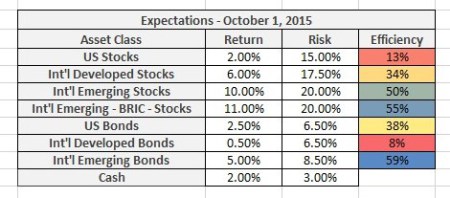
Dynamic Asset Class Expectations
Shiller’s 10 Yr. CAPE Ratio translates into a 2% 10 Yr. expected return on US stocks.
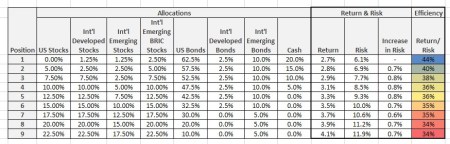
Dynamic Asset Allocation
Based on efficiency, the most attractive mix is position 1.
US + International Allocations
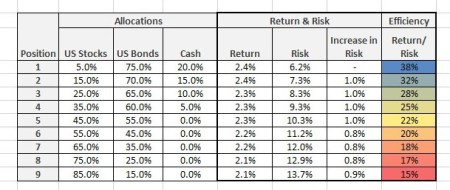
US Only Allocations
US Stock Sector – Fundamentals
Rank

US Stock Sector – Allocations
September Allocations

International Stock Allocations
When we look at Market Cap/GDP/Volatility (October), our most attractive countries are mostly emerging.

Trends – Trade Execution – Utilizing Monthly Price Trends (& US Volatility)
The following cyclical tables get to the heart of timing and when the trend in prices is optimal (bull) for buying.
US Stocks and Bonds
Stocks topped in July.
Bearish price / volatility trend is currently in place.

For bonds, the trend is neutral.

International Stocks
The trend for Developed and Emerging remains bearish.

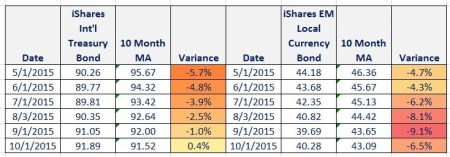
International Bonds
Developed bonds have turned neutral and Emerging remain bearish.
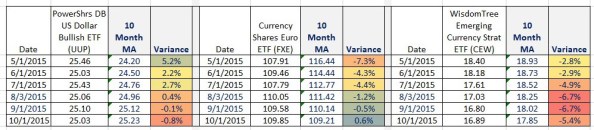
Currencies
The US dollar is neutral, the euro is neutral and Emerging Markets currency remains bearish.
Disclaimer: This is neither an offer to sell nor the solicitation of an offer to purchase any interest in or any other investments discussed. The ETFs identified in the report are utilized as asset class and currency proxies and are not intended as recommendations to buy or sell. This publication is for informational purposes only; it is not intended to be a solicitation, offering, or recommendation of any product, security, transaction, or service. It should not in any way be interpreted as investment, financial, tax, or legal advice. All data herein was obtained from publicly available information and/or sources, internally developed data, and other sources believed to be reliable. Except as otherwise stated, Mr. Grennon has not sought to independently verify information obtained from public or third party sources and makes no representations or warranties of any kind, express or implied, regarding the accuracy, completeness, or reliability of such information. Hypothetical and forward looking statements should not be taken as an indication or guarantee of any future performance, analysis, forecast, or prediction.