Employment – 5.1% official unemployment rate jumps to 23% if you include discouraged workers, year over year official rate trend: receding
Inflation (Personal Consumption Expenditures (PCE) price index) – price change year over year: 0.16%, trend: flat, core (excluding food and energy) price change year over year: 1.31%, trend: advancing
Housing – new home sales down 1.5%, year over year trend: flat, pending home sales down 2.3%, year over year trend: flat, median home prices surged to $296,900 (just shy of high), year over year trend: advancing
Sentiment – University of Michigan Consumer Sentiment rose from 87.2 in September to 90.0 in October, year over year trend: flat
Q3 GDP (advance) – 1.5%, year over year trend: advancing
Q3 GDP Forecast (final) – 1.1%, year over year trend: advancing
Q4 GDP Forecast – 1.9%, year over year trend: advancing
Employment
The Federal Reserve wants you to believe that the civilian unemployment rate has fallen to 5.1%. That is, the number of unemployed divided by the size of the civilian labor force.
According to the Bureau of Labor Statistics, who is not in the labor force? Those who are not classified as employed or unemployed during the survey reference week.
So what does this mean?
- Since 2010, for every person who dropped off the unemployment rolls, another joined the NOT in labor force rolls.
- For every person who is employed, there are TWO who are either unemployed or have dropped out of the labor force.
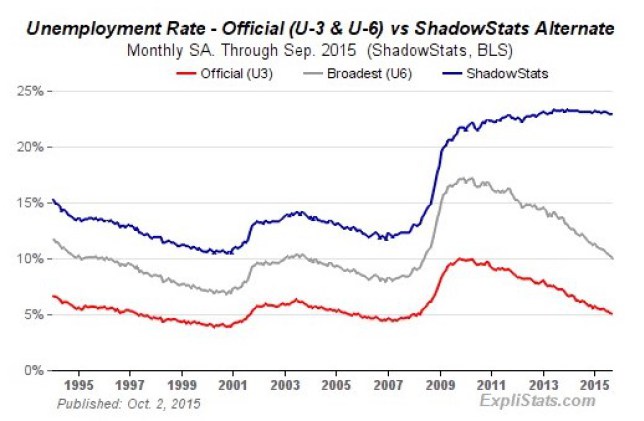
It means a more realistic unemployment rate is much higher, maybe closer to 23%.
The seasonally-adjusted ShadowStats Government Statistics (SGS) Alternate Unemployment Rate reflects the BEA’s current unemployment reporting methodology adjusted for:
- Estimated long-term discouraged (out of existence) workers (old BEA methodology prior to 1994).
- Short-term discouraged workers (old BEA methodology prior to 1994).
Here is the ShadowsStats Alternative rate against the BEA’s U-3 (official 5.1% rate) and U-6…
…and long-term here is where we are with the BEA’s official rate vs. employment, population and participation…
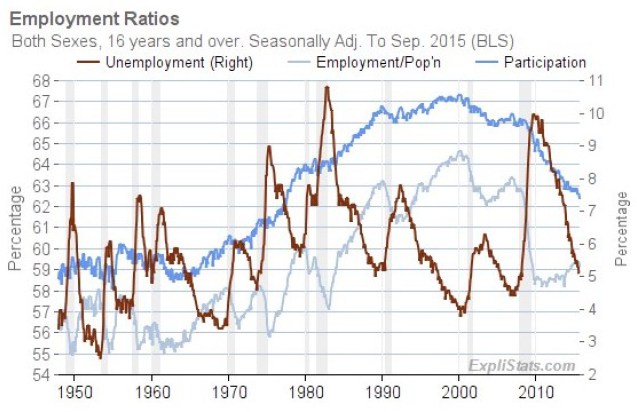
So let’s call the 5.1% unemployment rate as it is…arbitrary.
Especially since the Fed considers this rate “consistent with full employment.”
Inflation
The latest headline Personal Consumption Expenditures (PCE) price index year-over-year (YoY) rate is 0.16%, down from 0.32% last month. The latest Core PCE index (less Food and Energy) is at 1.31% is unchanged from the previous month…AND WELL BELOW the Fed’s 2% target.
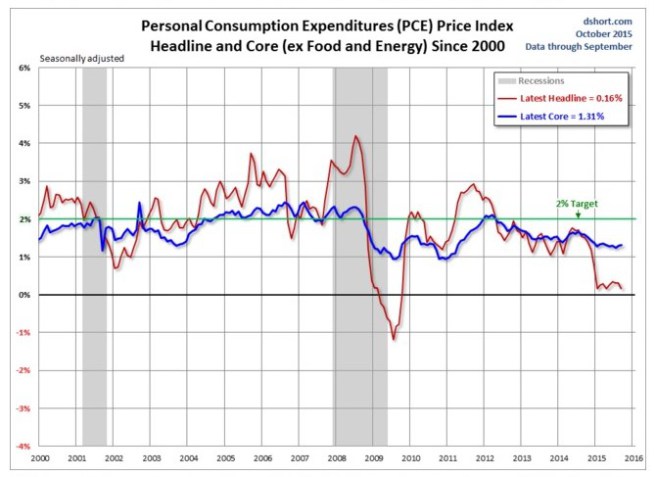
Since early 2013, the Core PCE Price Index has hovered in a narrow YoY range around 1.5%.
I guess with the economy at “full employment” and expenditure prices at “just about” 2% it must be time to raise rates!
Housing
New Home Sales plunged 1.5% in September and July and August data was revised DOWN to the current New Home Sales SAAR of 468k.
September had the largest MoM drop since July 2013 and with revisions, current New Home Sales SAAR is at its lowest since November 2014.
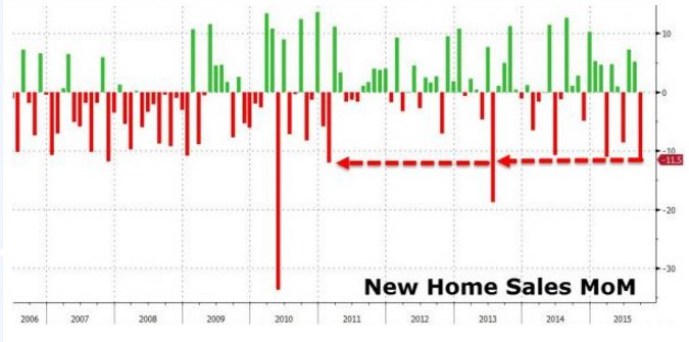
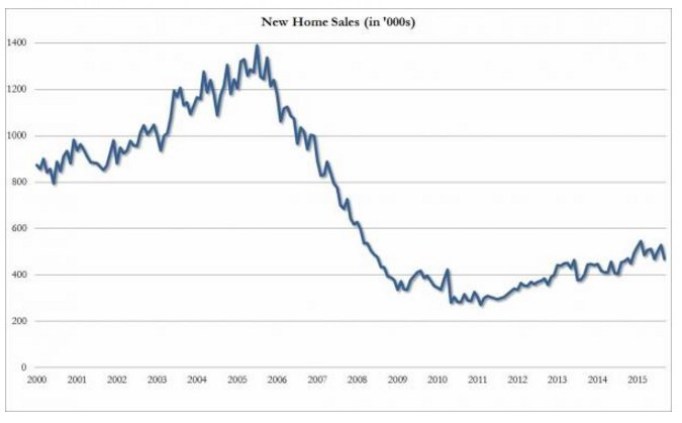
At the same time, median home prices surged to $296,900 – the highest in 2015 and just shy of an all-time high.
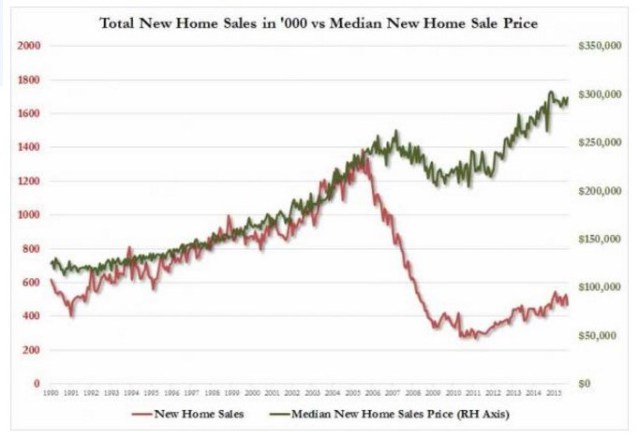
Pending Home Sales in September also plunged – dropping 2.3% MoM, the biggest MoM drop since Dec ’13 and the second lowest level of pending home sales this year.
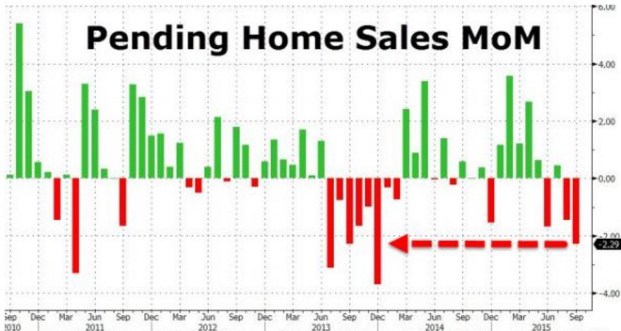
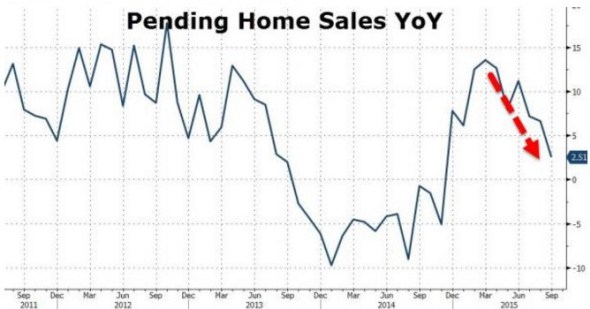
…and YoY growth trends lower…
Sentiment
University of Michigan Consumer Sentiment rose from 87.2 in September to 90.0 in October, the first bounce in 4 months.
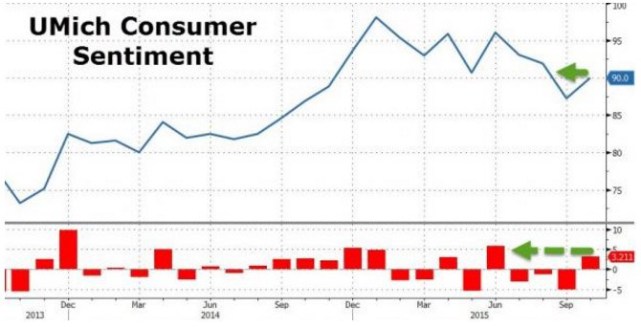
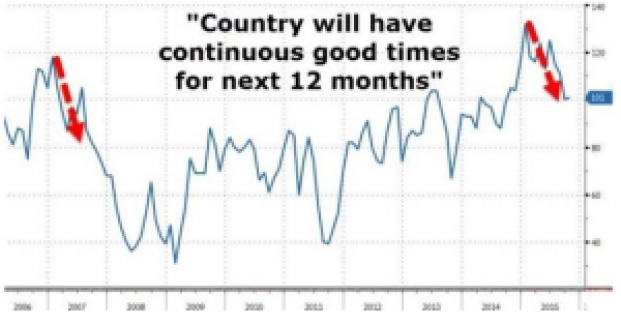
…HOWEVER expectations of good times ahead slide…
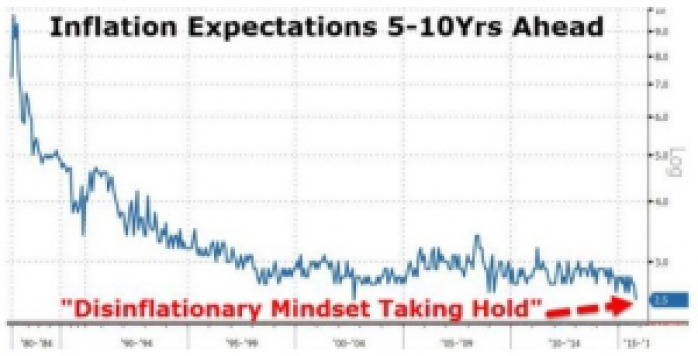
…AND inflation expectations turn dis-inflationary…
Q3 GDP
The advance estimate of Q3 real GDP was 1.5%.
Q3 GDP Forecast (final)
The FED’s GDPNow final model forecast for real Q3 GDP growth (seasonally adjusted annual rate) was 1.1% on October 30.
Q4 GDP Forecast
The FED’s GDPNow model forecast for real Q4 GDP growth (seasonally adjusted annual rate) was 1.9% on November 2.
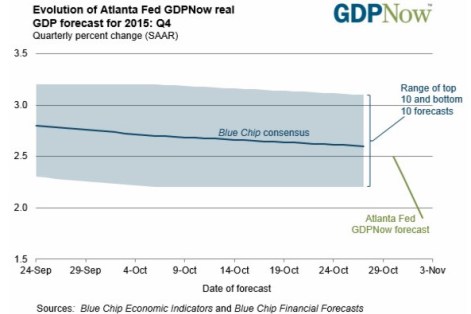
To learn more, visit Federal Reserve Bank of Atlanta’s website.
Asset Allocation Summary
Major Asset Class Allocations – 5% Stocks, 75% Bonds, 20% Cash
Int’l Developed Stock Allocations – 1.25% – Italy/Germany
Int’l Emerging Stock Allocations – 1.25% – Mexico/Indonesia
Int’l Emerging – BRIC Stock Allocations – 2.5% – Brazil/Russia
US Bond Allocation – 62.5%
Int’l Developed Bond Allocation – 2.5%
Int’l Emerging Bond Allocation – 10%
Asset Class Trends (for new allocation commitments)
Int’l Developed Stock Trend – bearish
Int’l Emerging Stock Trend – bearish
US Bond Trend – neutral
Int’l Developed Bond Trend – neutral
Int’l Emerging Bond Trend – bearish
US Dollar – neutral
Euro – neutral
Emerging Markets Currencies – bearish
OVERALL RECOMMENDATION – hold existing allocations / no new allocation commitments
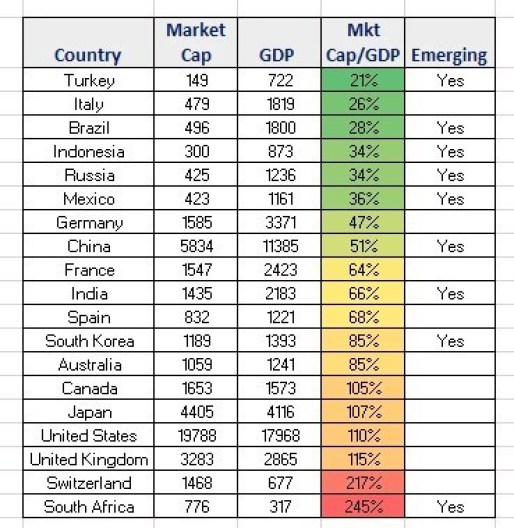
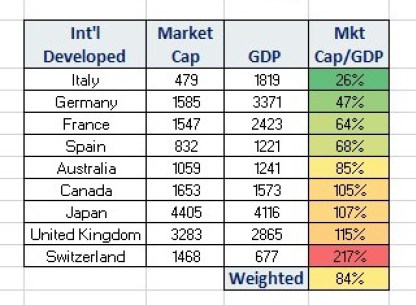
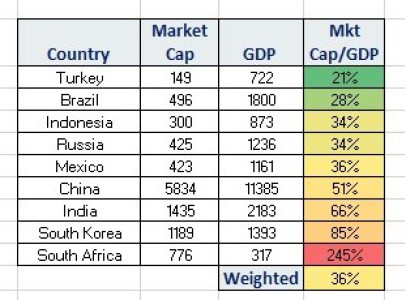
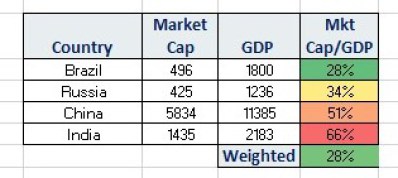
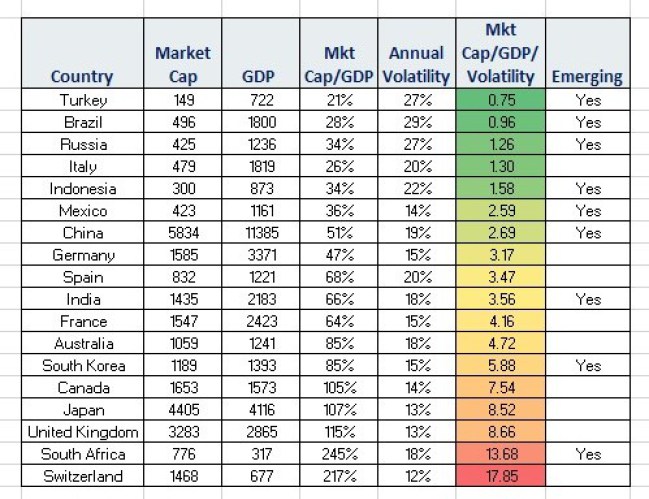
Country Stock Fundamentals – Market Cap/GDP ratios (October)
Int’l Emerging – BRIC offers the best opportunity based on their weighted Mkt Cap/GDP value to overall GDP weights across the globe.
Int’l Developed
Int’l Emerging
Int’l Emerging – BRIC
Yields
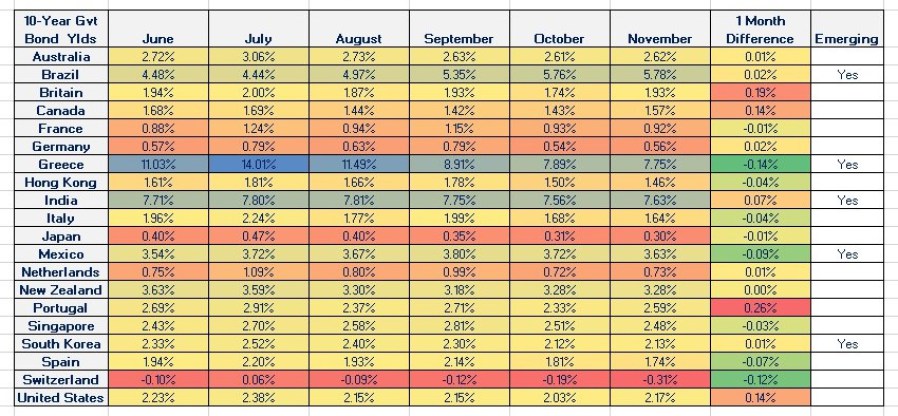
The 6 month trend in yields is down across almost all economies.
The one major exception is Brazil, which is experiencing both political and economic turmoil.
Dynamic Asset Class Expectations
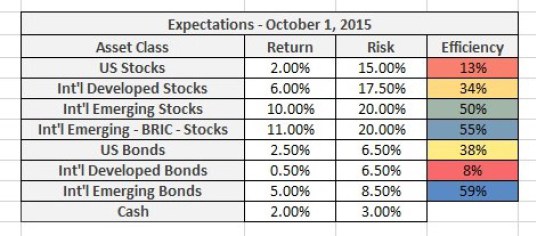
Shiller’s 10 Yr. CAPE Ratio translates into a 2% 10 Yr. expected return on US stocks.
Dynamic Asset Allocation
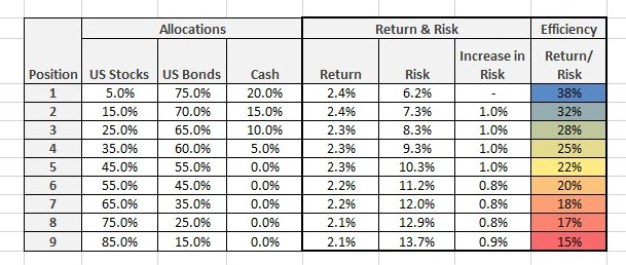
Based on efficiency, the most attractive mix is position 1.
US + International Allocations

US Only Allocations
US Stock Sector – Fundamentals
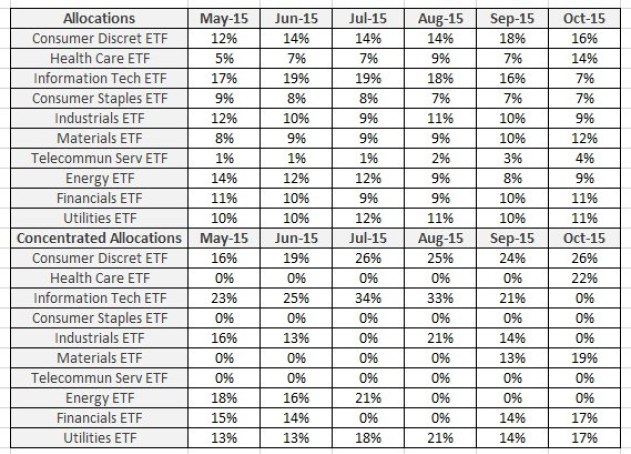
US Stock Sector – Allocations
International Stock Allocations
When we look at Market Cap/GDP/Volatility (October), our most attractive countries are mostly emerging.
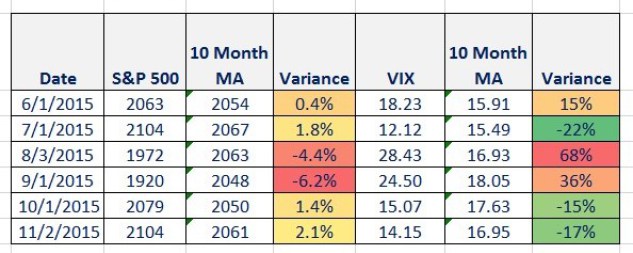
Trends – Trade Execution – Utilizing Monthly Price Trends (and US Volatility)
The following tables enable entry and exit execution for new allocations.
US Stocks and Bonds
Price and volatility levels are back to July levels… with a bullish trend currently in place.
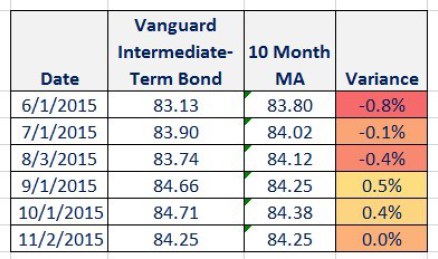
For bonds, the trend remains neutral.
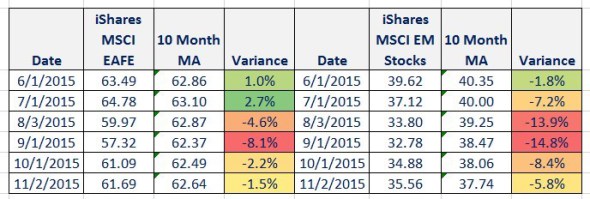
International Stocks
The trend for Developed and Emerging remains bearish.
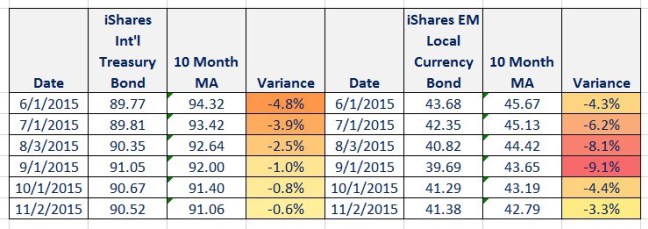
International Bonds
Developed bonds remain neutral and Emerging remains bearish.
Currencies
The US dollar is neutral, the euro is neutral and Emerging Markets currency remains bearish.

Disclaimer: The above report is neither an offer to sell nor the solicitation of an offer to purchase any interest in or any other investments discussed. The ETFs identified in the report are simply utilized as asset class and currency proxies and are not intended as recommendations to buy or sell. This publication is for informational purposes only; it is not intended to be a solicitation, offering, or recommendation of any product, security, transaction, or service. It should not in any way be interpreted as investment, financial, tax, or legal advice. All data herein was obtained from publicly available information and/or sources, internally developed data, and other sources believed to be reliable. Except as otherwise stated, Mr. Grennon has not sought to independently verify information obtained from public or third party sources and makes no representations or warranties of any kind, express or implied, regarding the accuracy, completeness, or reliability of such information. Hypothetical and forward looking statements should not be taken as an indication or guarantee of any future performance, analysis, forecast, or prediction.
