Final hours! Save up to 55% OFF InvestingProCLAIM SALE

The S&P 500: Then And Now

Published 11/18/2013, 01:51 PM
US500
-

It may seem like a faint memory, but this time last year the S&P 500 was sitting at the bottom of a 9% pullback. At the low of that drawdown, November 15, the S&P 500 hit a closing low of 1353. Exactly one year later, the S&P 500 closed up 32% from that date last Friday.

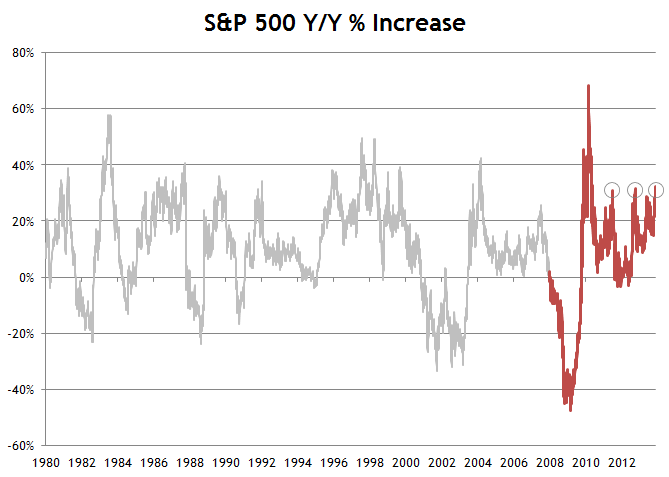
The pace of that 12 month increase has been matched two other times during this bull market. In both October 2012 and July 2011 the index was up more than 30% since the previous year. Each of those dates were followed by drawdowns over the next couple of months. In 2010 the 12 month trailing gain exceeded the current pace by a large margin. After bottoming in March 2009, the S&P 500 was up more than 60% over the next 12 months.

The chart below includes data going back to 1980 for historical perspective. There are plenty of other times that the index was up more than this in a 12 month period, but eyeballing the data, the 12 month increase generally tops out between 20-40%. Given the arithmetic, larger gains tend to come about in a bear market recovery.

The pace of increase is likely to slow from here since there haven’t been many drawdowns to speak of in 2013. The only pullback of any significance this year took place in June. If the index is up 30% from that point in June 2014, it would break the 2000 level.

S&P 500 Performance
Original Post

The information in this blog post represents my own opinions and does not contain a recommendation for any particular security or investment. I or my affiliates may hold positions or other interests in securities mentioned in the Blog, please see my Disclaimer page for my full disclaimer.

Latest comments

Loading next article…
Risk Disclosure: Trading in financial instruments and/or cryptocurrencies involves high risks including the risk of losing some, or all, of your investment amount, and may not be suitable for all investors. Prices of cryptocurrencies are extremely volatile and may be affected by external factors such as financial, regulatory or political events. Trading on margin increases the financial risks.
Before deciding to trade in financial instrument or cryptocurrencies you should be fully informed of the risks and costs associated with trading the financial markets, carefully consider your investment objectives, level of experience, and risk appetite, and seek professional advice where needed.
Fusion Media would like to remind you that the data contained in this website is not necessarily real-time nor accurate. The data and prices on the website are not necessarily provided by any market or exchange, but may be provided by market makers, and so prices may not be accurate and may differ from the actual price at any given market, meaning prices are indicative and not appropriate for trading purposes. Fusion Media and any provider of the data contained in this website will not accept liability for any loss or damage as a result of your trading, or your reliance on the information contained within this website.
It is prohibited to use, store, reproduce, display, modify, transmit or distribute the data contained in this website without the explicit prior written permission of Fusion Media and/or the data provider. All intellectual property rights are reserved by the providers and/or the exchange providing the data contained in this website.
Fusion Media may be compensated by the advertisers that appear on the website, based on your interaction with the advertisements or advertisers.
© 2007-2024 - Fusion Media Limited. All Rights Reserved.