What is the relationship between the market and recessions? Is there are causal relationship between the two? Does a recession lead to a decline in the market or does a market decline foreshadow a recession?
As a first wave Boomer, I've lived through eleven official recessions -- as determined by the NBER -- and I have distinct memories of recession stresses as far back as the 1957-1958 downturn. My father was a painting contractor in Daytona Beach, Florida. In those early days of his business, a recession forced changes on our household budget that didn't go unnoticed by a pre-teen.
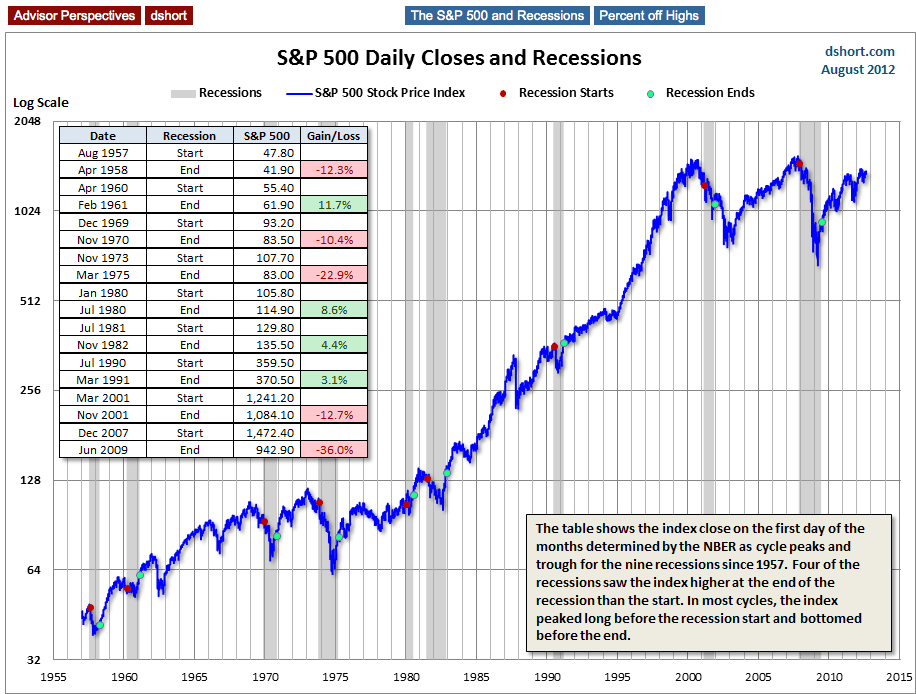
For a quick look at the market-recession correlation since the mid-1950s, here is a chart of S&P 500 daily closes stretching back to the launch of the index in 1957. I've also highlighted recessions.
The table in the chart above shows the index close on the first day of the months determined by the NBER as cycle peaks and troughs for the nine recessions since 1957. Four of the recessions saw the index higher at the end of the recession than the start. In most cycles, the index peaked long before the recession start and bottomed before the end.
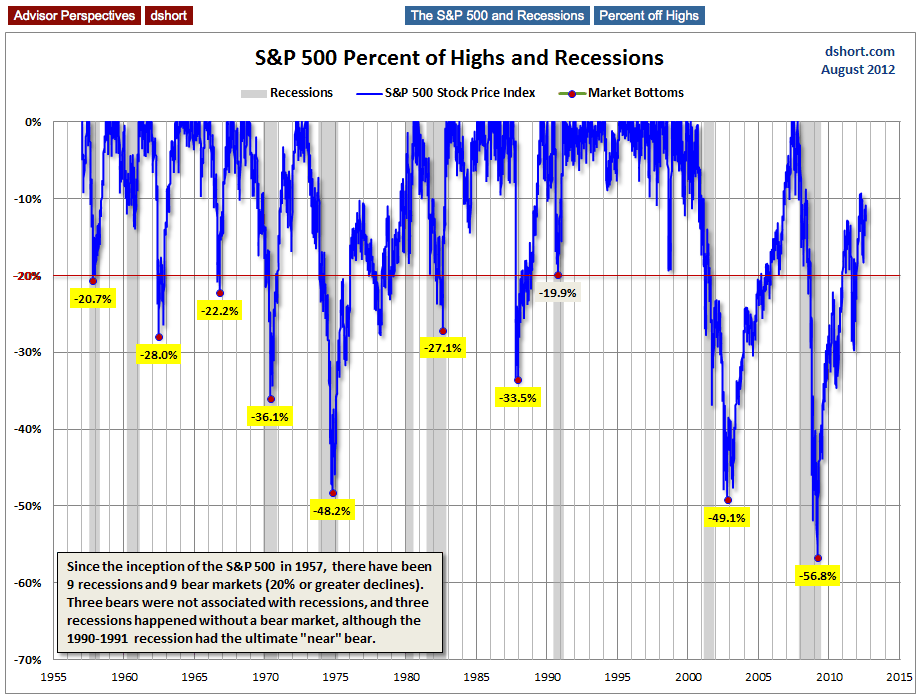
To get a better idea of the lag between recession starts and index peaks, I've charted the same index using a "percent off high" technique. In other words, I plot successive new index highs at zero and the cumulative percent declines of days that aren't new highs. The advantage of this approach is that it helps us visualize declines more clearly and facilitates a comparison of the depth and duration of declines across time.
Since the inception of the S&P 500 in 1957, there have been 9 recessions and nine bear markets (20% or greater declines). However, three bears were not associated with recessions, and three recessions happened without a bear market, although the 1990-1991 recession had the ultimate "near" bear with its 19.9%.
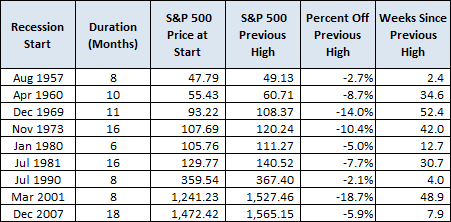
Here is a table showing the key data: Recession starts, the index price on the first market day of the recession, the previous index high, the percent off the previous high at the recession start, and the number of weeks from the previous high to the recession start.
Some Observations
Market indexes and recessions are two very different data series. The closing price of the S&P 500 is a real-time snapshot of equities. In sharp contrast, recession boundaries are determined many months, sometimes a year or more, after the fact, for both the starts and ends (peaks and troughs). The NBER makes its call after lengthy deliberations over economic data that has been subjected to extensive revisions.
Economists often make generalizations about business cycles that suggest a substantial commonality among them. But that's true only at a 20,000 foot level (and on a partially cloudy day). Recessions are dramatically different from one another if viewed within their individual economic and market contexts. Exogenous events can play a role, as in the case of the 1973 Oil Embargo. The prevailing inflation rate can be a key difference maker e.g., the double dip recessions in the early 1980s. I would also suggest that demographics can be a determinant in recession's personality. For example, compare the demographics of the Boomer cohort in the 1970s and 1980s, in their earlier careers, with the aging Boomer workforce during the last recession, when an alternative to unemployment was early retirement.
The U.S. economic recovery since the official trough in June 2009 has been much weaker than hoped and there are many financial pundits who agree with ECRI's latest assertion that a new recession is underway, a view that, I would counter, is not supported by the Big Four economic indicators.
We will, of course, eventually slide into a recession. It's an inevitable part of the business cycle. But the data presented here illustrates that the relationship between the market and recessions varies widely. Investment planning based on recession forecasting is definitely not a foolproof strategy.
- English (UK)
- English (India)
- English (Canada)
- English (Australia)
- English (South Africa)
- English (Philippines)
- English (Nigeria)
- Deutsch
- Español (España)
- Español (México)
- Français
- Italiano
- Nederlands
- Português (Portugal)
- Polski
- Português (Brasil)
- Русский
- Türkçe
- العربية
- Ελληνικά
- Svenska
- Suomi
- עברית
- 日本語
- 한국어
- 简体中文
- 繁體中文
- Bahasa Indonesia
- Bahasa Melayu
- ไทย
- Tiếng Việt
- हिंदी
The S&P 500 And Recessions
Latest comments
Loading next article…
Install Our App
Risk Disclosure: Trading in financial instruments and/or cryptocurrencies involves high risks including the risk of losing some, or all, of your investment amount, and may not be suitable for all investors. Prices of cryptocurrencies are extremely volatile and may be affected by external factors such as financial, regulatory or political events. Trading on margin increases the financial risks.
Before deciding to trade in financial instrument or cryptocurrencies you should be fully informed of the risks and costs associated with trading the financial markets, carefully consider your investment objectives, level of experience, and risk appetite, and seek professional advice where needed.
Fusion Media would like to remind you that the data contained in this website is not necessarily real-time nor accurate. The data and prices on the website are not necessarily provided by any market or exchange, but may be provided by market makers, and so prices may not be accurate and may differ from the actual price at any given market, meaning prices are indicative and not appropriate for trading purposes. Fusion Media and any provider of the data contained in this website will not accept liability for any loss or damage as a result of your trading, or your reliance on the information contained within this website.
It is prohibited to use, store, reproduce, display, modify, transmit or distribute the data contained in this website without the explicit prior written permission of Fusion Media and/or the data provider. All intellectual property rights are reserved by the providers and/or the exchange providing the data contained in this website.
Fusion Media may be compensated by the advertisers that appear on the website, based on your interaction with the advertisements or advertisers.
© 2007-2025 - Fusion Media Limited. All Rights Reserved.
