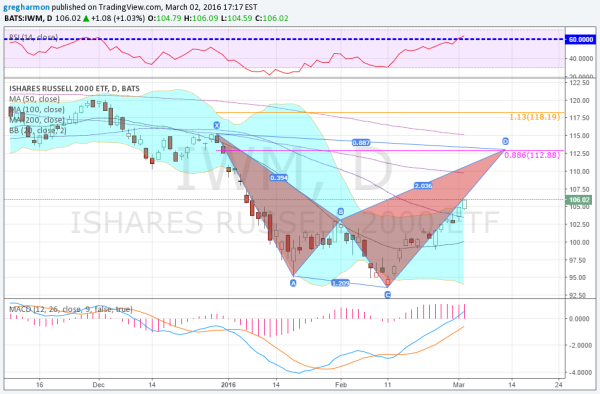
2016 has been a rough year for stocks. January was the worst start to the market ever and by mid February it looked like the world was going to end. But the 11th marked a bottom and all indexes reversed higher. There is still a lack of investor conviction that this leg up will stick and not turn into another rout to the downside.
When I look at the chart for the iShares Russell 2000 ETF (NYSE:IWM) I see many reasons to get happy about the prospects of more upside though. There are at least 4 such indications in the chart below, in addition to the obvious short term uptrend. First is the harmonic Shark pattern. This carries two Potential Reversal Zones (PRZ), the first at 112.88 and and second at 118.19. This is where the pattern would look for a reversal.

The second is the Bollinger Bands® that are opening to the upside as price is riding the envelope higher. Momentum is one the side of higher prices too. The MACD has been rising since mid January, but has now crossed to positive. Finally the RSI is rising and has now moved into the bullish zone.
The world may end and stock prices collapse, but that is not what the price action is showing right now.
Disclosure: The information in this blog post represents my own opinions and does not contain a recommendation for any particular security or investment. I or my affiliates may hold positions or other interests in securities mentioned in the Blog, please see my Disclaimer page for my full disclaimer.
