Symmetry plays a huge role in our lives. You see it in every major architectural building before Frank Lloyd Wright. It appears everywhere in nature, like this tree above. You are symmetrical, with a hand, arm, leg, ear, eye on each side of your body. We are used to it so it pleases our eye. So it should not surprise you when there is symmetry exhibited in the market.
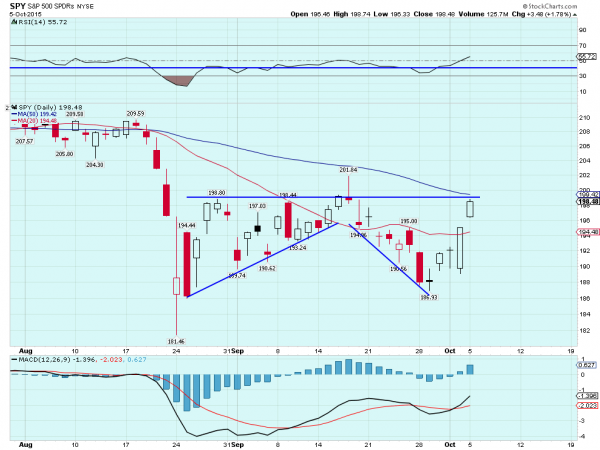
The chart below of the SPDR S&P 500 (NYSE:SPY) since the beginning of August shows just that. From the start of the fall August 20th it hit bottom August 24th. From there the SPY consolidated in an ascending triangle over 17 trading days followed by a Shooting Star top. What has happened since then? An expanding wedge over the next 12 days.

The right side has had the same resistance level so far, and has been expanding but not beyond the left side bottom. Symmetry would suggest there may be another 5 days of retracement and push higher before it is complete. And from there? The current momentum indicators support a break to the upside. If that happens symmetry would suggest a move higher to the 210 area.
The RSI is making a higher high and over the mid line for the first time since the fall. The MACD is moving higher and crossed up as well. But just because it looks nice, does not mean that it WILL happen. Keep an open mind but observe how price reacts.
The information in this blog post represents my own opinions and does not contain a recommendation for any particular security or investment. I or my affiliates may hold positions or other interests in securities mentioned in the Blog, please see my Disclaimer page for my full disclaimer.
