The euro had a long transition in to being. Starting as a concept in 1995 and then an accounting currency in 1999, it made it to the big time as a hard currency, replacing all the currencies of constituent countries on January 1, 2002. With lofty goals all countries involved vowed to toe the line on inflation and budget deficits to keep the currency strong. As you can guess, cheating started against these goals right away.
Almost as long as the currency has been in existence there have been gripes and complaints from the various strong countries against the weaker ones. But through time more countries joined the original 11 in adopting the currency and now there are 19 countries using it, as long as Greece is still in while you are reading this. Now 16 years in to the grand experiment, there is another stress to the currency and it looks like this one might last.

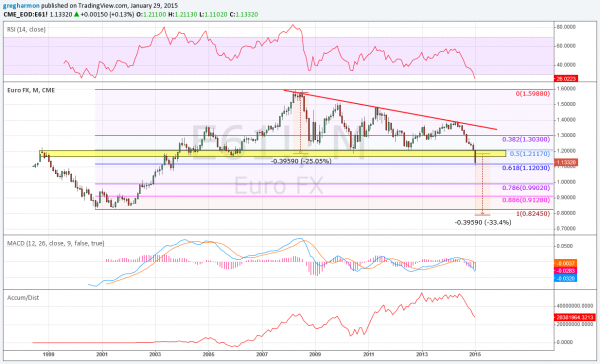
The chart above shows the euro on a monthly basis over its existence against the US dollar. There is a strong run higher off of the bottom in 2001 and 2002 up to the peak in 2007. But then a consolidation in the form of a descending triangle took over. That triangle lasted 7 years before breaking down in January. Recall that the US dollar also had a 7 year cycle. The break down out of the triangle carries a target to 0.79. This would be a new all time low. This break also crossed under the 200 month SMA (not shown) that tightly tracked the yellow support zone.
And the momentum indicators back up that potential. The MACD is running lower. The RSI is oversold on this basis, but firmly in the bearish range. A bounce or consolidation before another leg lower is a distinct possibility. A look at the move lower compared to the upward 7 year path shows that it has retraced 61.8% of that move. So if it wanted to consolidate or bounce this would be a good point for it to happen at around 1.12.
But the accumulation/distribution statistic shows holders dumping the currency and no bottom in sight. The next stop lower from a technical perspective would be 0.99, at the 78.6% retracement of the up leg. This could be a magnet if it drops under 107 or 108 with the likely increased talk of parity with the dollar that would build at that point. But without much price history at that level it is very easy to see a move to 0.912 or even 0.824 again.
It seems the 1.12 level in the short term may hold the key to whether the euro continues its monster breakdown directly, or after a pause, or it reverses back higher. There will be a lot of traders, economists and politicians watching this one. You should too.
Disclaimer: The information in this blog post represents my own opinions and does not contain a recommendation for any particular security or investment. I or my affiliates may hold positions or other interests in securities mentioned in the Blog, please see my Disclaimer page for my full disclaimer.
