Who are the victims in the mediocre employment situation? It is not people over 55, women, Hispanics or the educated.
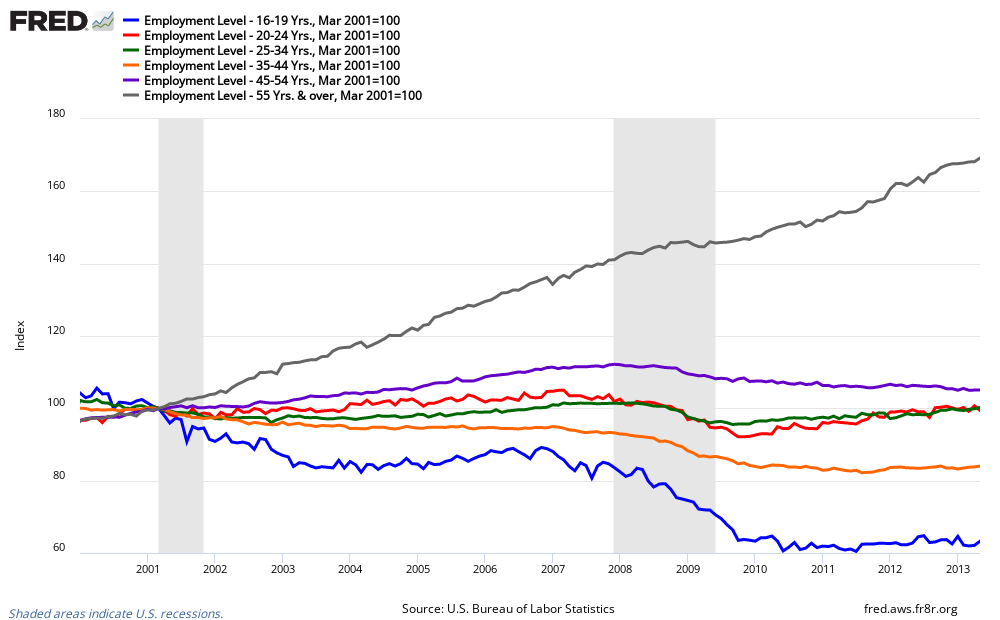
Please note that the graphs below are indexed on the start date of the 2001 recession.
It is a striking statistic that people 55 and up not only did not experience negative employment effects from the Great Recession – but the jobs held by this group pretty much continued to expand at pre-recession trend lines.
- Employment in the next age group down (45 to 54) is still contracting long after the end of the Great Recession;
- Employment levels in age group 35 to 44 have not recovered from the effects of the recession – and the situation remains static for over 3 years;
- The age groups from 20 to 34 have almost fully recovered to pre-recession levels and are on a growth trend line;
- And the youngest segment of the population (16 through 19) continues to suffer the worst effects of the recession.

Women are doing better than men. Could this relate to more woman being employed in sectors less effected by economic slowdown such as health care or education?
Index of Employment Levels – Men (blue line) vs Women (red line)

Mom and Pop concerns’ employment is sucking swamp water – and remains at twenty first century lows.

The less education one has, the less chance of finding a job. Being educated seems an advantage to having a job. Is it the fact one has a piece of paper? Or just smarter in finding the pathway to employment? Or are those with degrees better prepared for employment? Or more adaptable to employment changes? Perhaps some of all four factors?
Index of Employment Levels – University graduate (blue line), Some college or AA degree (orange line), high school graduates (green line), and high school dropouts (red line)

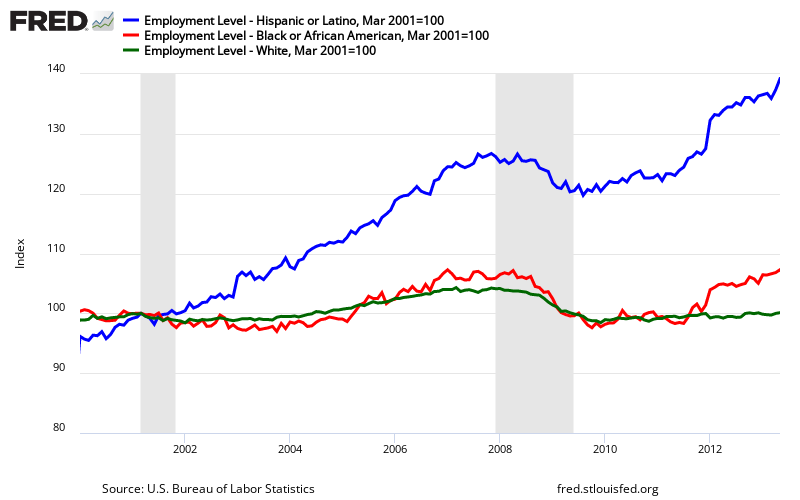
One significant observation – being white is not helpful for employment. FRED does not have data series for Asians, but the BLS does – and indexed Asian employment levels are similar to Hispanic.
Index of Employment Levels – Hispanic (blue line), African American (red line), and White (green line)

There is only one point I am making in this post: demographics of overall trends in employment have changed.
Other Economic News this Week:
The Econintersect economic forecast for June 2012 again declined marginally, and remains under a zone which would indicate the economy is about to grow normally. The concern is that consumers are spending a historically high amount of their income.
The ECRI WLI growth index value has been weakly in positive territory for over four months – but in a noticeable improvement trend. The index is indicating the economy six month from today will be slightly better than it is today.
Current ECRI WLI Growth Index

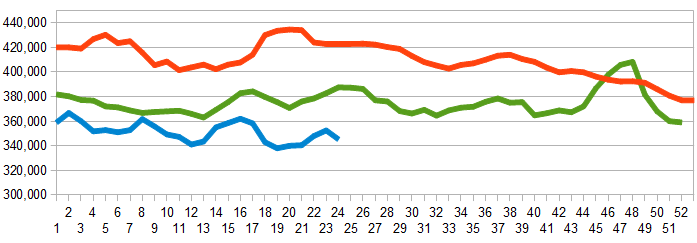
Initial unemployment claims declined from 346,000 (reported last week) to 334,000 this week. Historically, claims exceeding 400,000 per week usually occur when employment gains are less than the workforce growth, resulting in an increasing unemployment rate (background here and here).
The real gauge – the 4 week moving average – worsened from 352,500 (reported last week) to 345,250. Because of the noise (week-to-week movements from abnormal events AND the backward revisions to previous weeks releases), the 4-week average remains the reliable gauge.
Weekly Initial Unemployment Claims – 4 Week Average – Seasonally Adjusted – 2011 (red line), 2012 (green line), 2013 (blue line)

Bankruptcies this Week: Exide Technologies, Privately-held NE Opco (dba National Envelope)
Data released this week which contained economically intuitive components(forward looking) were:
- Rail movements are beginning to show a modest growth trend.
Weekly Economic Release Scorecard:
Click here to view the scorecard table below with active hyperlinks

