Crude Oil has been moving higher for 7 months after lifting off of a June low. Now reaching multi-year highs it has stalled and pulled back a couple of times over the month of January. Is this the top and its time to sell Oil? Actually, one aspect of the price action suggest another surge higher and a new multi-year high is in the works.
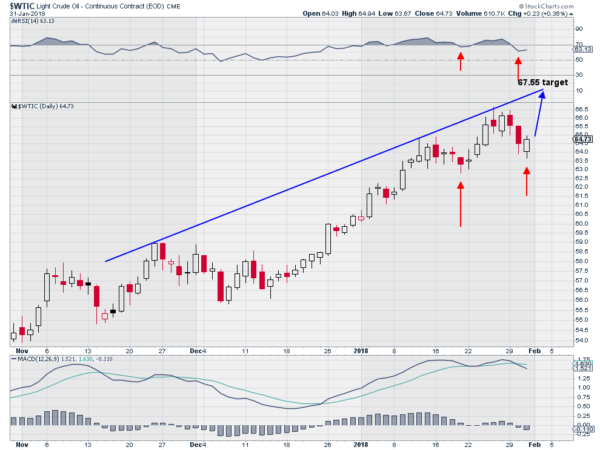
The chart below shows the last 3 months of price action in Crude Oil. During that period it has bounced off of rising trend resistance 3 times since mid-November. It is the last two pullbacks that are worth noting. On January 19th the price pulled back to a low and then it reversed higher the next day. As it made that low the RSI also ‘bottomed’ barely moving down out of a technically overbought condition.
The next pullback bottomed January 31st and recovered that day. In early hours on February 1st that move up is continuing. Notice though that the corresponding low in the RSI was deeper this time. This combination of a lower low in RSI with a higher low in price creates a Positive RSI Reversal. This phenomenon suggests a move back higher and to a new high at 67.55 or more. A Quick move would place the price right back at the rising trend resistance.
The information in this blog post represents my own opinions and does not contain a recommendation for any particular security or investment. I or my affiliates may hold positions or other interests in securities mentioned in the Blog, please see my Disclaimer page for my full disclaimer.

