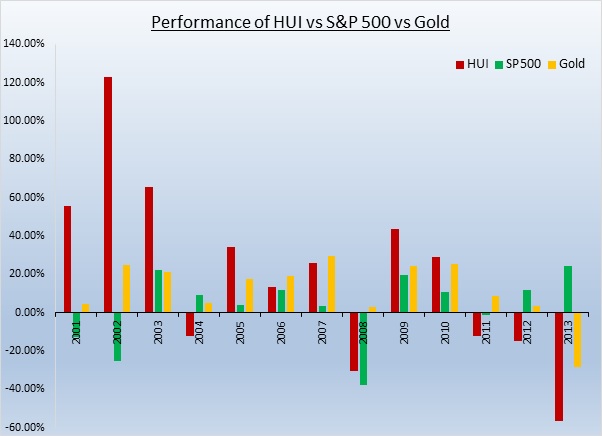
We have long held the view that mining stocks are poor performers; last year we made 16 trades to this effect and made money on every single one. The sector has underperformed both precious metals and equities in general in recent years, and even lost money in 2011 when gold made all-time highs.
Despite the abysmal returns, many bulls have their heart set on owning the stocks in the HUI, which has only outperformed gold in three of the last ten years, 2005, 2009, and 2010; in each year the gain was less than twice that of gold. In every other year of the last decade, mining stocks have failed to keep pace with gold.The industry has also managed to lose value in half of the last eight years.
This inability to make gains while gold has been setting all-time highs has lead us to make multiple short trades on the sector throughout the history of our service, all of which have contributed to our overall return of 855.77%.
Having followed the performance of the gold mining sector we noted a relatively strong correlation with the movement in gold prices, as well as a weaker, but still notable, correlation with general equities. Owing to this we sought a method to be short mining stocks, but to remove the risk of a rally in either gold or equities dragging the sector up. This would involve being short the miners through GDX, while being simultaneously long both gold and the S&P 500, via GLD and SPY respectively.With this in place, one is short only the worst performing part of the mining sector, having hedged the risk of a rally in gold or the broader stock market.
One could simply allocate half of a portfolio to the GDX short side and a quarter to each of the other legs.However, this would be a rather crude way of going about the trade, given the different strengths in correlation. Therefore, we used the adjusted R2 value, as well as the individual correlations, between the mining sector, gold, and equities, to generate the allocations for this portfolio.
By this method we would have always been short 1 unit of GDX and would be long a lesser amount of GLD and SPY. The resultis that one would be short only the poor performing mining sector. Thus, the risk to of a rally in gold or equities hurting a short trade on the miners would be reduced.
When analysing a how a trade or portfolio will perform, we always consider the reality of opening and closing the positions involved. In the case of thisportfolio, this meant that if our calculations indicated we should buy less than one tenth of a share in GLD or SPY for every share that we were short GDX, then we would not open that particular leg in our portfolio. To adjust the allocations on a regular basis we set analysis to open the trade on the first trading day of each month and close it on the last. We ran this to as far back as 2008, thus covering some of the worst and best performing years for gold and equities, including the global financial crisis and collapse in gold last year. We believe the result is an accurate and realistic representation of how the portfolio would have performed, had it actually been run.
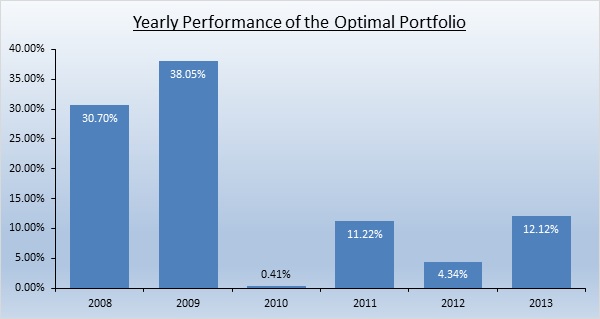
Since the start of 2008 to the end of 2013this portfolio would have increased by 105.79%, making money every year. The chart below shows the individual yearly performance. 
The key here to focus on here is that this portfolio would have made money every year that it was run. This means that being short the actual mining part of the gold mining sector, having removed the equity and gold element, is a profitable trade year in year out. If nothing else, this highlights the appalling performance of the industry.
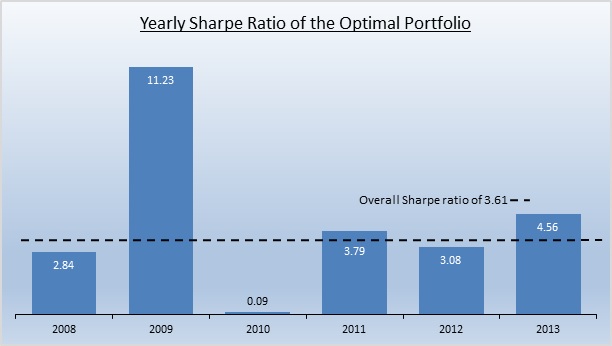
Whenever we consider making a trade or running a portfolio, we examine the risks that we are taking on as well as the profits that we hope to gain. One way of considering these dynamics is the Sharpe ratio. This calculation considers the variance of a portfolio, which indicates the potential losses, against the excess return above the risk free rate. We have fixed our risk free rate of return at 0.25% in this analysis, which is greater than the 1 year Treasury Bill rate has been since 2008.
For those of you that are unfamiliar with how to interpret the Sharpe ratio, a value of 1 would mean the excess return above the risk free is equal to the standard deviation of the portfolio; in laymen’s terms, that the return justifies taking the risk. From the chart above we can see that the only year in which the risks were not made up for the excess return was 2010; a year in which a profit was still made. Over the 6 year course of running this portfolio the Sharpe ratio would have been 3.61, with a value of 4.56 last year. We can glean from this that, on average, the risks taken are massively outweighed by the returns made.
One could be short the gold mining sector without the risk of a rally in gold or equities and would have made a profit each year that they did so, even throughout the GFC, the collapse in gold, and with gold’s rise to over $1900. These profits would have also been made with highly favourable risk reward dynamics. When one considers this, it is clear to see that they should not be long gold stocks if they wish to make money.
This portfolio idea is more for those with a longer term horizon and less active traders. We are an active trading operation and therefore have traded the same themes discussed in this article, but from more of a tactical stance, rather than strategic one.
Disclaimer:
SK Options Trading makes no guarantee or warranty on the accuracy or completeness of the data provided. Nothing contained herein is intended or shall be deemed to be investment advice, implied or otherwise. This letter represents our views and replicates trades that we are making but nothing more than that. Always consult your registered advisor to assist you with your investments. We accept no liability for any loss arising from the use of the data contained on this letter. Options contain a high level of risk that may result in the loss of part or all invested capital and therefore are suitable for experienced and professional investors and traders only. One should be familiar with the risks involved in options trading and we recommend consulting a financial adviser and/or viewing the SEC Options page if you feel you do not understand the risks involved in options:
Original post
- English (UK)
- English (India)
- English (Canada)
- English (Australia)
- English (South Africa)
- English (Philippines)
- English (Nigeria)
- Deutsch
- Español (España)
- Español (México)
- Français
- Italiano
- Nederlands
- Português (Portugal)
- Polski
- Português (Brasil)
- Русский
- Türkçe
- العربية
- Ελληνικά
- Svenska
- Suomi
- עברית
- 日本語
- 한국어
- 简体中文
- 繁體中文
- Bahasa Indonesia
- Bahasa Melayu
- ไทย
- Tiếng Việt
- हिंदी
Optimal Portfolio: Short Gold Miners, Long Gold, Long Equities
Published 01/08/2014, 06:33 AM
Updated 07/09/2023, 06:31 AM
Optimal Portfolio: Short Gold Miners, Long Gold, Long Equities
Latest comments
Loading next article…
Install Our App
Risk Disclosure: Trading in financial instruments and/or cryptocurrencies involves high risks including the risk of losing some, or all, of your investment amount, and may not be suitable for all investors. Prices of cryptocurrencies are extremely volatile and may be affected by external factors such as financial, regulatory or political events. Trading on margin increases the financial risks.
Before deciding to trade in financial instrument or cryptocurrencies you should be fully informed of the risks and costs associated with trading the financial markets, carefully consider your investment objectives, level of experience, and risk appetite, and seek professional advice where needed.
Fusion Media would like to remind you that the data contained in this website is not necessarily real-time nor accurate. The data and prices on the website are not necessarily provided by any market or exchange, but may be provided by market makers, and so prices may not be accurate and may differ from the actual price at any given market, meaning prices are indicative and not appropriate for trading purposes. Fusion Media and any provider of the data contained in this website will not accept liability for any loss or damage as a result of your trading, or your reliance on the information contained within this website.
It is prohibited to use, store, reproduce, display, modify, transmit or distribute the data contained in this website without the explicit prior written permission of Fusion Media and/or the data provider. All intellectual property rights are reserved by the providers and/or the exchange providing the data contained in this website.
Fusion Media may be compensated by the advertisers that appear on the website, based on your interaction with the advertisements or advertisers.
© 2007-2025 - Fusion Media Limited. All Rights Reserved.
