It’s the soft demand season for gold (April-Sept), and that means upside and downside breakouts can become “wet noodle” affairs.
Bulls and bears who aren’t prepared for this type of sideways price action may get frustrated.

The short-term gold chart.
My suggestion for investors is to focus on the important price zone of $1800 for modest selling, and $1675 and $1575 for buying.
Most price action in between these zones is likely to be just “noise”…until later in the summer when stock market crash season (Aug-Oct) gets underway.
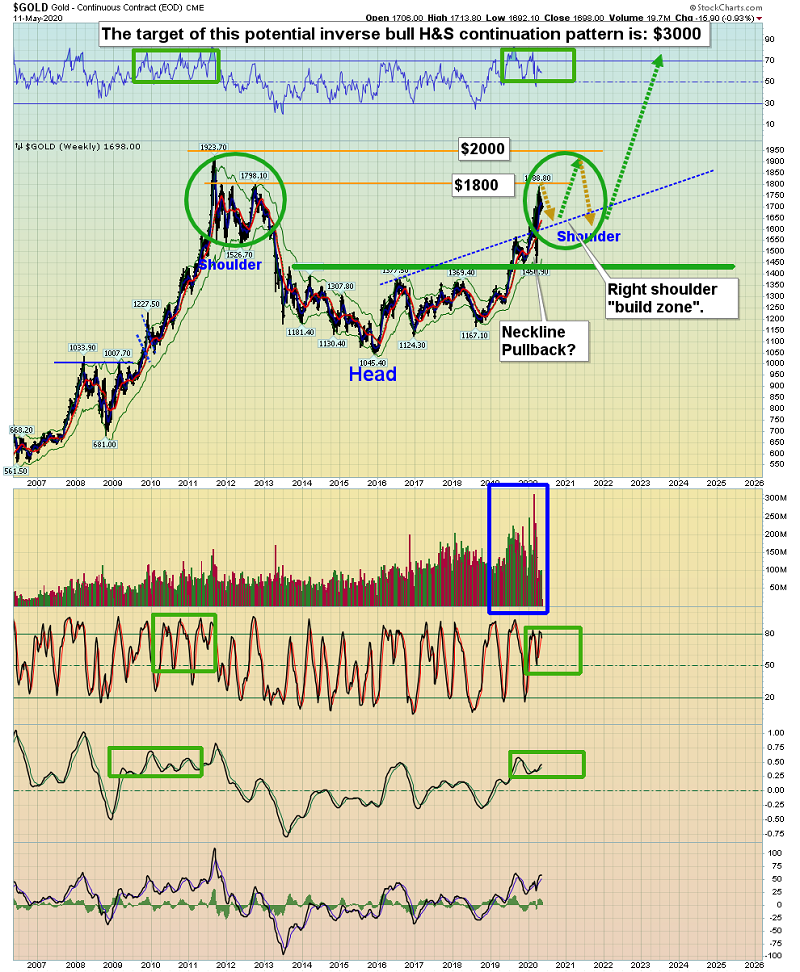
My scenario of a gigantic inverse H&S bull continuation pattern on the long-term gold chart suggests gold has entered the right shoulder “build zone”.
Gold could trade near $1800 numerous times and trade near $1675/$1575 numerous times, perhaps for as long as a year, before shooting above $2000.
Investors need to prepare for all scenarios, not just those that feel good or seem most likely.
The smart play is to just focus on the buy zones of $1675, $1575, be patient, and enjoy the right shoulder formation process.
A glorious surge towards the $3000 area is the most likely event after the right shoulder is completed.
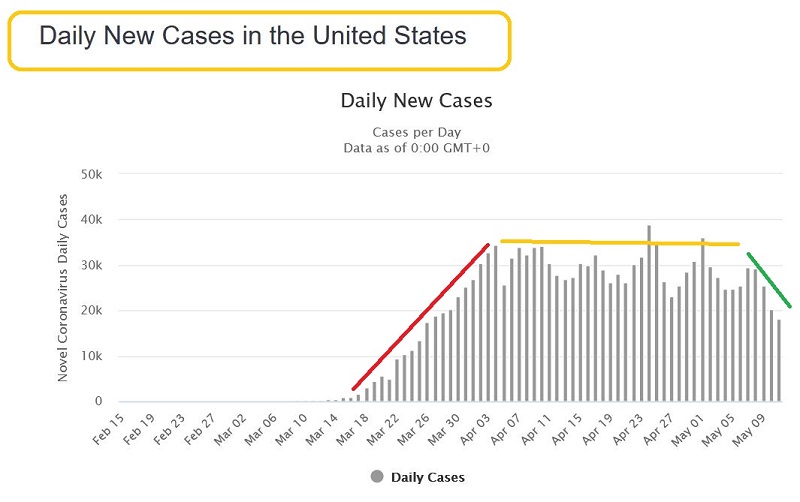
If US Corona cases are truly beginning to subside, life can return to normal:
The citizen horses can march back into the graduated income tax glue factory and send the government slave masters their money. The government will borrow even more money than it extorts from the citizens and quickly spend it on everything except crisis preparation. Then it will brag in hourly tweets about how great the debt-fuelled future will be. The bottom line:
The old normal is back. Got gold?
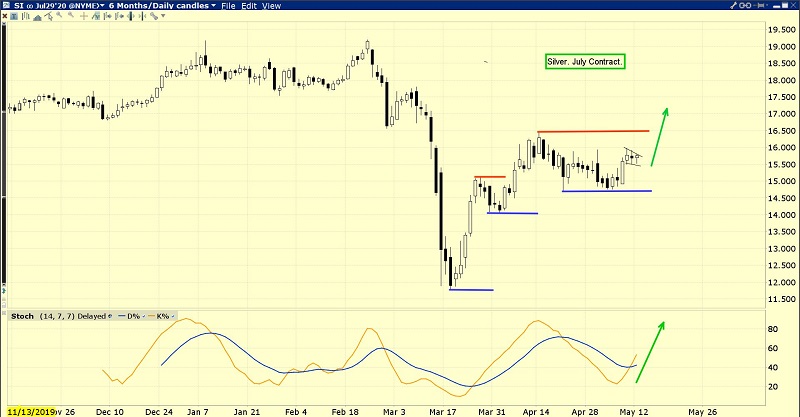
The big picture for gold is very bright, but in the short-term, silver looks more perky than gold!
There’s solid staircase action in play, and stoploss enthusiasts could buy now with a stop at $14.90 or $14.50.
If the July silver contract trades above $15.50, a surge to $16.50 and then to $18 is likely.
The leading price action of some silver stocks suggests this is now the most likely scenario for the silver price.
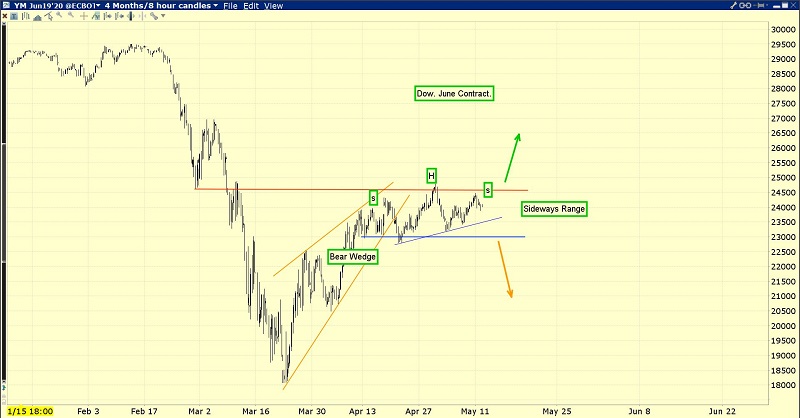
The only potential fly in the silver price ointment is of course a fall in the US stock market.
The stock market has become the government’s “poster boy” for the economy. Minor issues like 25% unemployment, an out of control debt, no savings, and no preparation for crisis…
These issues don’t worry the government, because the central bank’s electronic photocopiers keep printing money and pouring it into ETFs and government bonds.
If there isn’t enough money printing and the stock market tumbles, silver could take a hit. No market is without risk, but the risk for silver investors is modest if it’s handled professionally. Investors can use stoplosses at my suggested price points. Or, just buy with modest size, so there’s not much pain on a price dip.
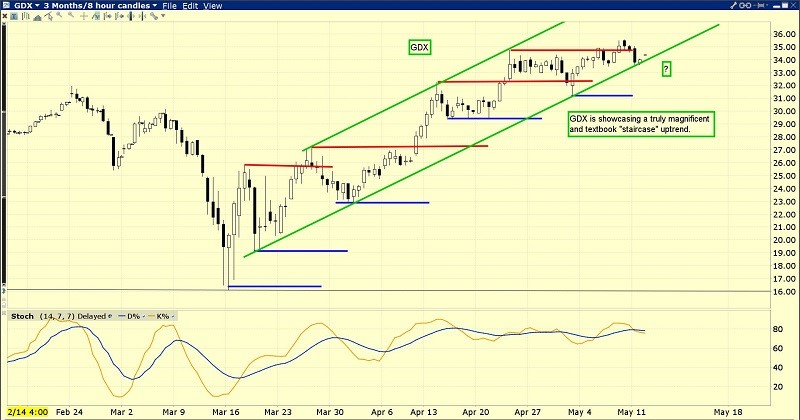
“Work of art” GDX (NYSE:GDX) chart.Is the magnificent uptrend “long in the tooth”, or is it just a prelude to a much bigger rally being ushered in by a significant weekly chart upside breakout?
A price dip below the uptrend line would be disappointing, but it should be followed by simple consolidation, much like what is occurring on the gold bullion chart now.
There’s resistance of size in the $37 area for GDX, and that’s where I suggest investors plan to do their first significant selling on this magnificent rally!
