The Oil Servicers Look Solid

Published 02/21/2014, 08:07 AM
Updated 05/14/2017, 06:45 AM

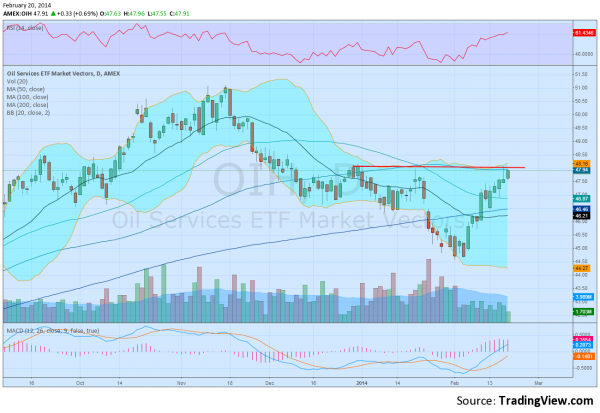
Crude Oil (USO) has had a great run since early January, moving from over 10% on the West Texas Intermediate. The Oil Servicers (OIH) have also done quite well rising about 8%. In fact the Servicers look that they could continue for quite some time if they can just go a little higher. The chart below shows the OIH is at resistance at 48. A level that has stopped it since Christmas. The RSI and MACD both are rising, supporting a break out.

Market Vectors Oil Services

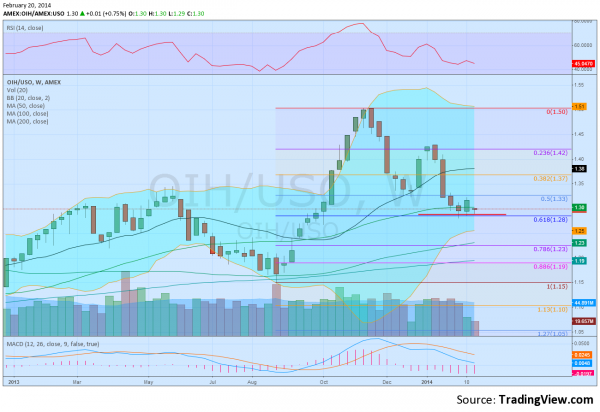
And a break out higher does not see resistance again until 49.50 and then 51. Not a bad place to be. But Crude Oil looks good too, so why shift? It is the relative strength chart that gives an answer. The weekly chart below of the Servicers measured against Crude Oil shows the under performance with a falling ratio on the chart. But there are 3 reasons in that chart that suggest a shift from Oil to Servicers is warranted, at least for a trade. First the pullback is finding support, and for a prolonged period of time. Nearly a month. The other two reasons are about where that support is. It happens to be at both a 61.8% retracement of the move higher from the August 2013 low and at the 50 week Simple Moving Average (SMA). Using a stop under the the support ratio at 1.28 gives a good place from a risk reward perspective to try the reversal higher, if not just an OIH position outright.

OIH vs. USO

The information in this blog post represents my own opinions and does not contain a recommendation for any particular security or investment. I or my affiliates may hold positions or other interests in securities mentioned in the Blog, please see my Disclaimer page for my full disclaimer.

Original post

Latest comments

Loading next article…
Risk Disclosure: Trading in financial instruments and/or cryptocurrencies involves high risks including the risk of losing some, or all, of your investment amount, and may not be suitable for all investors. Prices of cryptocurrencies are extremely volatile and may be affected by external factors such as financial, regulatory or political events. Trading on margin increases the financial risks.
Before deciding to trade in financial instrument or cryptocurrencies you should be fully informed of the risks and costs associated with trading the financial markets, carefully consider your investment objectives, level of experience, and risk appetite, and seek professional advice where needed.
Fusion Media would like to remind you that the data contained in this website is not necessarily real-time nor accurate. The data and prices on the website are not necessarily provided by any market or exchange, but may be provided by market makers, and so prices may not be accurate and may differ from the actual price at any given market, meaning prices are indicative and not appropriate for trading purposes. Fusion Media and any provider of the data contained in this website will not accept liability for any loss or damage as a result of your trading, or your reliance on the information contained within this website.
It is prohibited to use, store, reproduce, display, modify, transmit or distribute the data contained in this website without the explicit prior written permission of Fusion Media and/or the data provider. All intellectual property rights are reserved by the providers and/or the exchange providing the data contained in this website.
Fusion Media may be compensated by the advertisers that appear on the website, based on your interaction with the advertisements or advertisers.
© 2007-2025 - Fusion Media Limited. All Rights Reserved.