Crude oil had a very strong move higher off of a bottom at the beginning of the year. 6 months into the rally it had moved almost 100% higher. Everything was looking up. And then it started to roll lower in July.
With just two trading days left if the month it is showing a very strong move downward. Is this normal digestion of the run higher? Or has the rally fizzed and dried up?
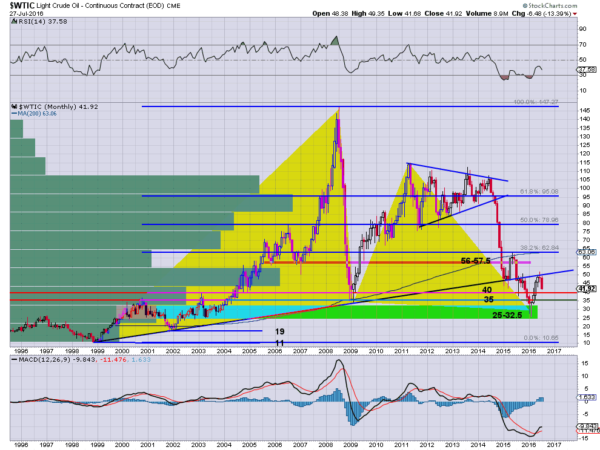
The long term monthly chart below may give some insights. The first thing to focus on is the rising trend line off of the 1999 low. This held oil as support for 16 and a half years until it broke down below it in August last year.
After the break down crude oil continued lower until printing two candles with long lower shadows, a bottom signal, in January and February. The rise began from there and look where it found trouble. Right at that trend line. What was once support was now resistance.

A doji candle at resistance, signaled indecision. And that resolved to the downside at the start of July. And with gusto. Without a strong bounce it will print a bearish Marubozu candle for July. This would be one indication that the entire rally from January to June was just a Dead Cat Bounce. The chart would also give a possible downside target.
Looking at the bounce from April 2015 to June 2015 and then the retrace lower there is a parallel like read to this move. The bounce was the same height and the drop from June 2015 to the low in January, a move of $35, would give a target below to $16.
There are no guarantees that it will get to $16. And there is real support just below $35 and then at the Potential Reversal Zone (PRZ) of the Bat around $29. What does seem clear though is that the long term trend for oil has turned back lower.
DISCLAIMER: The information in this blog post represents my own opinions and does not contain a recommendation for any particular security or investment. I or my affiliates may hold positions or other interests in securities mentioned in the Blog, please see my Disclaimer page for my full disclaimer.
