🐂 Not all bull runs are created equal. November’s AI picks include 5 stocks up +20% eachUnlock Stocks

The NYSE’s McClellan Oscillator Did Something Unique: What Does It Mean?

Published 08/12/2017, 10:47 PM
Updated 07/09/2023, 06:31 AM


On Friday, the NYMO (McClellan Oscillator for the NYSE; a market breadth indicator) closed below its lower Bollinger Band (BB) for the 4th consecutive day (see my tweet and prior tweet here). The last time it did this was in early-March of this year (see orange vertical lines) and this brings the total of “4x” over the past 20 years (for which I have data) to 4. A rare occasion which all led to a multi-day bounce followed by lower prices. The chart below only shows the current and prior occasion (orange vertical lines).
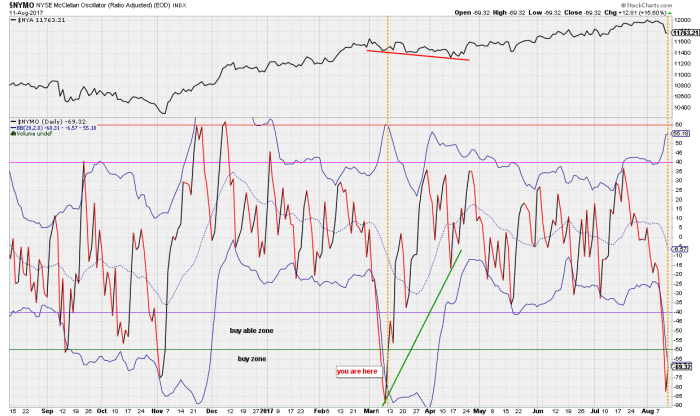
NYMO Daily Chart

The 2nd chart I wanted to show is that of the equities only put/call ratio (CPCE), which I’ve not shown and/or mentioned for a while as there was not much to mention. But, it closed on Friday at 0.94, which is a rather extreme reading and well-inside the “top imminent” zone: too many traders are now expecting continued downside and opened put-options positions. Hence the high put/call ratio (almost 1-to-1). Since the market often punishes the majority, max-pain is now inflicted by price going back up.
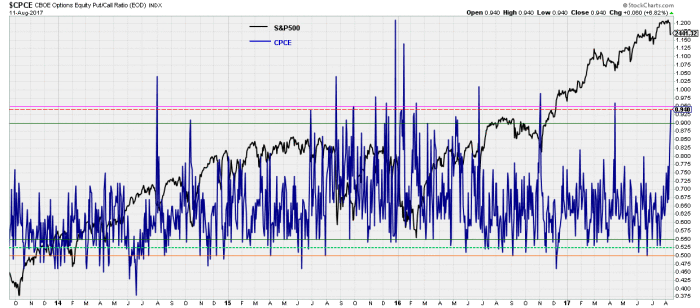
CPCE Daily Chart

Together with several other indicators I showed in the weekly digest available to my premium members, the weight of the evidence thus points to a bounce over the next few days. My ideal target zone for this bounce is SPX2457-2474. Once it completes I can then assess price targets for the next leg down more accurately.

Latest comments

Loading next article…
Risk Disclosure: Trading in financial instruments and/or cryptocurrencies involves high risks including the risk of losing some, or all, of your investment amount, and may not be suitable for all investors. Prices of cryptocurrencies are extremely volatile and may be affected by external factors such as financial, regulatory or political events. Trading on margin increases the financial risks.
Before deciding to trade in financial instrument or cryptocurrencies you should be fully informed of the risks and costs associated with trading the financial markets, carefully consider your investment objectives, level of experience, and risk appetite, and seek professional advice where needed.
Fusion Media would like to remind you that the data contained in this website is not necessarily real-time nor accurate. The data and prices on the website are not necessarily provided by any market or exchange, but may be provided by market makers, and so prices may not be accurate and may differ from the actual price at any given market, meaning prices are indicative and not appropriate for trading purposes. Fusion Media and any provider of the data contained in this website will not accept liability for any loss or damage as a result of your trading, or your reliance on the information contained within this website.
It is prohibited to use, store, reproduce, display, modify, transmit or distribute the data contained in this website without the explicit prior written permission of Fusion Media and/or the data provider. All intellectual property rights are reserved by the providers and/or the exchange providing the data contained in this website.
Fusion Media may be compensated by the advertisers that appear on the website, based on your interaction with the advertisements or advertisers.
© 2007-2024 - Fusion Media Limited. All Rights Reserved.