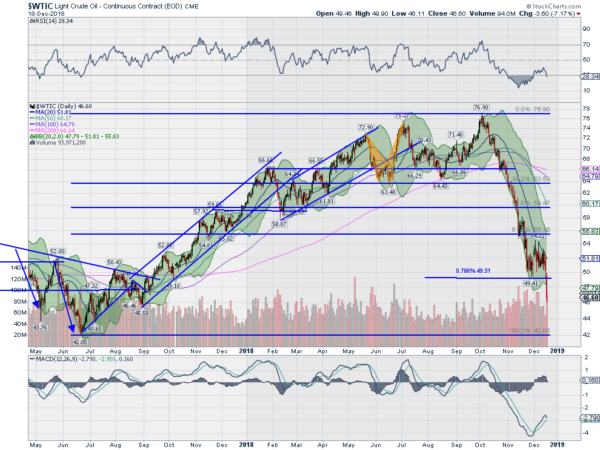
Crude Oil reached a peak at the same time as the stock market, at the end of September. It started lower then, falling to its 200 day SMA over the next 3 weeks and then settling. But that did not last long. It quickly resumed the path lower, confirming a double top at the end of October, then continuing lower.
It paused again as it hit a 61.8% retracement of the move higher from the June 2017 low. And then into November continued down to the 78.6% retracement where it found some support. It held there for nearly a month as the 20 day SMA caught up, before the latest leg lower.

With that break, Crude Oil seems destined for a full retracement of the move up from the 2017 low at $42. But will that end the plunge? From a price action perspective it would be the Measured Move equivalent to the drop from the consolidation in the middle of November to the last 3 week stall. But the bigger picture still looks bleak.

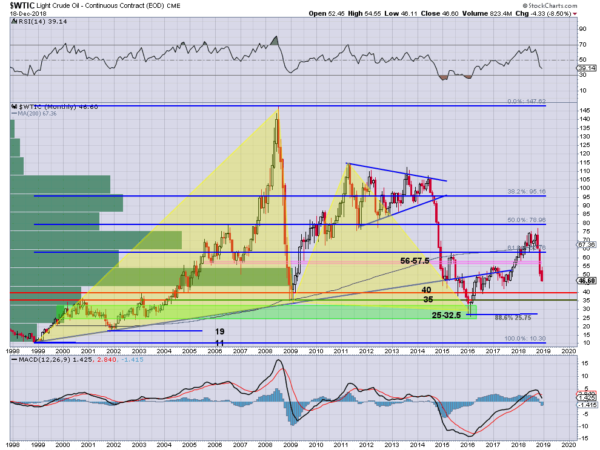
It is early, but the monthly chart for Crude Oil is showing strong downside tendencies. The momentum indicators are just turning bearish with the RSI under 40 and the MACD crossing down. Major support levels on the longer scale appear at 40 and 35 then 32.50 for Crude Oil. So there could be a lot more pain for investors. If it happens lets hope we see some benefits at the pumps.
The information in this blog post represents my own opinions and does not contain a recommendation for any particular security or investment. I or my affiliates may hold positions or other interests in securities mentioned in the Blog, please see my Disclaimer page for my full disclaimer.
