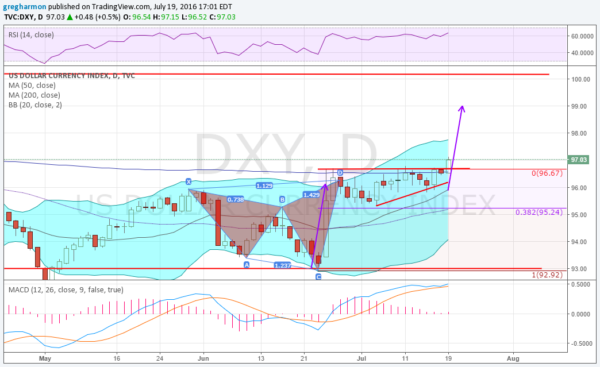
The US Dollar Index has traded in a tight range between 93 and 100 since January 2015. 18 months in that same range. Most recently it has floundered at the bottom of that range, pushing through the 93 level for a day in May, and retesting it in late June.
But following the Brexit vote the US dollar surged higher. A quick two day move to the 200 day SMA and it was up almost 4%. All looked promising for the greenback. Momentum was pointing higher as well. It had popped out of its Bollinger Bands® so perhaps it needed a few days of consolidation before moving again. A few days turned into nearly a month.

It started looking like a bull flag. And if you noticed the bearish Shark harmonic, then as the flag approached a 38.2% retracement of the pattern you may have hopped on board.
The thrust higher July 5th was the start of the latest move. It reached the 200 day SMA again and stalled, but pulled back to a higher low. Another push to resistance at 96.50 and then Tuesday a break to the upside. Separation from resistance.
Measuring a Move from the bottom to the month long consolidation higher gives a target to 99. That would put it firmly back in the top of the range. And would likely signal a return to the 100 level in the near term. Are you ready to take the next step?
DISCLAIMER: The information in this blog post represents my own opinions and does not contain a recommendation for any particular security or investment. I or my affiliates may hold positions or other interests in securities mentioned in the Blog, please see my Disclaimer page for my full disclaimer.
