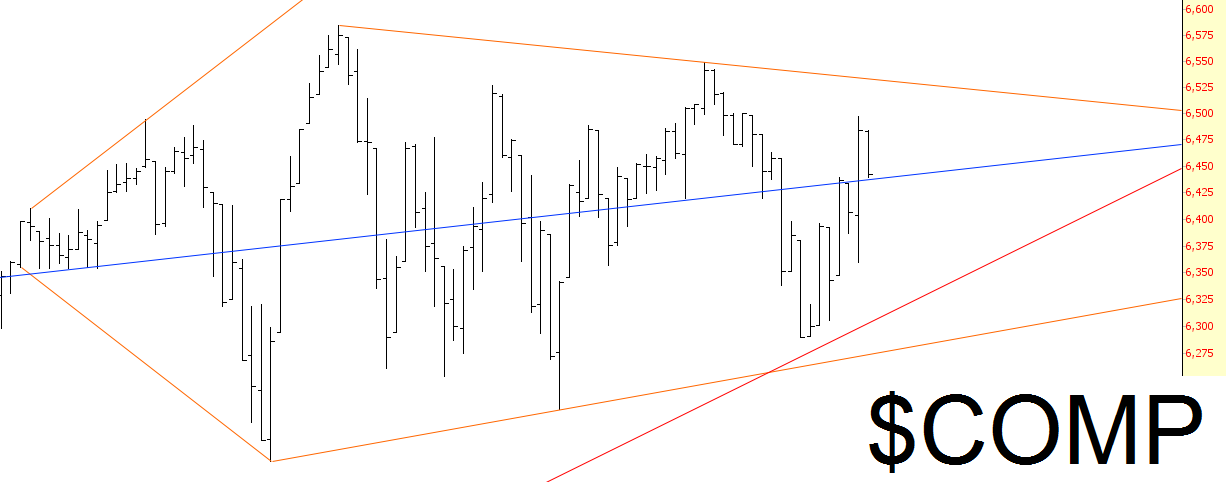
Well, the Dow Jones Composite has been the subject of my oft-cited Ichthus pattern (which at this point is resembling a piranha). I decided to update it somewhat to take into account recent price activity, and this is what I see:

The most fascinating thing to me is that blue line, which has been acting as a virtual mid-line to the pattern. What’s cool is that this isn’t a line I put into the pattern over its brief lifespan. The anchor point for this pattern is freakin’ May 1999. Price action seems to be dancing above and below this line, but the damned thing won’t break in either direction.
Indeed, the market as a whole hasn’t been able to make up its mind since QE ended. In spite of all the news events, currency wars, Fed jawboning, and other nonsense………we’ve been stuck basically since last Halloween!
You can read my mind, though. I’d love to see this break firmly to the downside. There’s nothing in the pattern to suggest a break in either direction, though. It’s just kind of…stuck. So my portfolio position is simple to explain: I am very long gold and the euro, and I’m short a bazillion lovingly-chosen U.S. stocks and ETFs. Let’s get this fish to stink up the place, eh, compadres?
