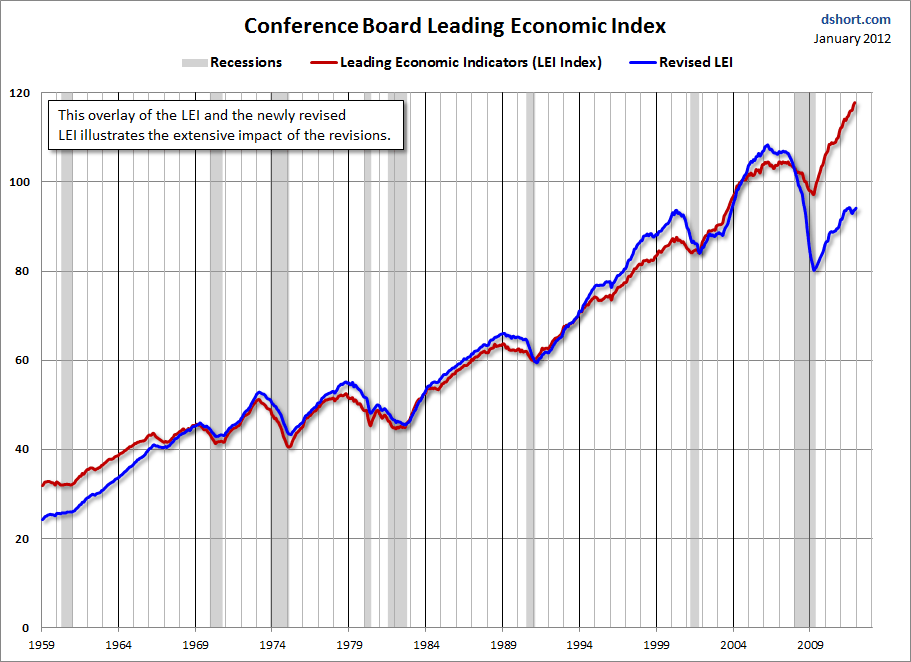
Yesterday the Conference Board released its latest Leading Economic Index (LEI) for the U.S., an announcement I haven't yet featured with a series of charts and commentary. Frankly, I'm still grappling with the major overhaul of the index, which includes extensive changes that extend to its earliest data in 1959. But here is a first effort at highlighting the changes.
Early in January the CB announced that it would be changing the index. See for example this Bloomberg news release. Actually, a couple of weeks before the announcement, some CB researchers published a SSRN paper on the topic, 29 scholarly pages, which included an overlay of the old and new LEI data.
The essence of the changes is made clear in the SSRN abstract:
In this paper we present the case for replacing three of the components and making a minor adjustment to one other component. The resulting index addresses structural changes that have occurred in the U.S. economy in the last several decades. The changes in the LEI composition include: 1) incorporating in the LEI a new Leading Credit Index (LCI) rather than real money supply (M2) starting in 1990 (real M2 remains in the index before 1990); 2) replacing the ISM Supplier Delivery Index with the ISM New Orders Index; 3) replacing the Reuters/University of Michigan Consumer Expectations Index with an equally weighted average of consumer expectations of business and economic conditions using questions from surveys conducted by Reuters/University of Michigan and The Conference Board; and 4) replacing "New Orders for (nondefense) Capital Goods" with "New Orders for (nondefense) Capital Goods excluding Aircraft." These changes are assessed using turning point analysis, probit models and an indicator scoring system based on Markov Switching models. Real time out-of-sample forecasting exercises are used to confirm that the changes to the composition help the LEI forecast more accurately future economic conditions.
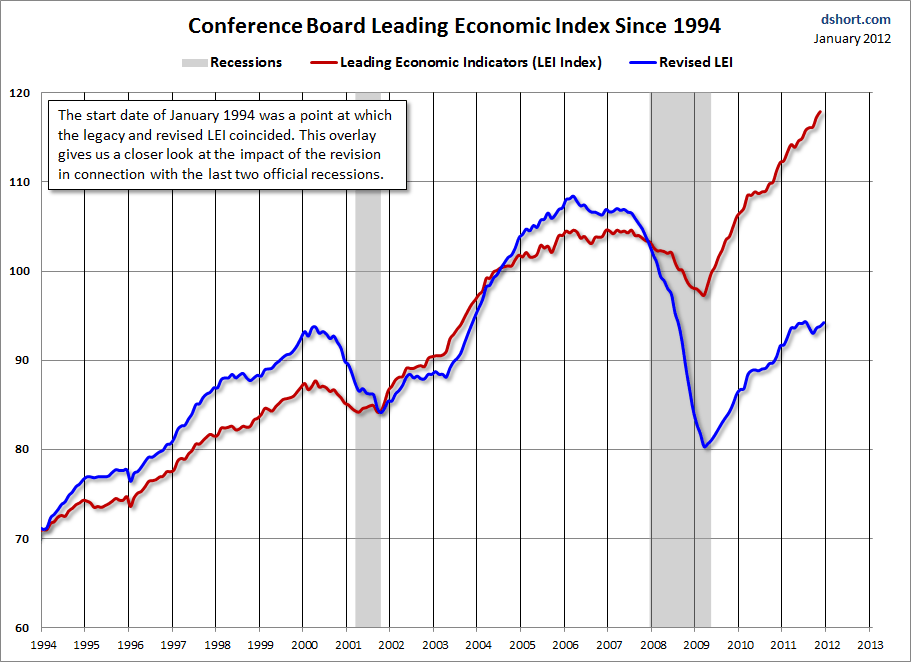
Here a chart overlaying the complete LEI series in its legacy and revised states. I've also documented recessions as identified by the NBER. For a closer look at the magnitude of the changes in the context of the last two recessions, here is an overlay starting in January 1994, a point at which the legacy and revised LEI coincided.
 For an equally dramatic illustration of how the revisions impact the index data, especially in the context of the last recession, here is an overlay of the two showing the percent of the previous peak. Essentially, I've sued a simple Excel formula to plot months that set new highs at 100% and the other months by the percent off the previous high.
As we see in the chart above, the old LEI was setting new highs six months after the end of the last recession. The new LEI is an astonishing 13.1% below its all-time high 31 months after the recession ended.
In yesterday's press release, the Conference Board touted the enhanced accuracy of the LEI with a generally positive forecast -- "cautious optimism" -- to be precise:
"Revised figures show that adding the new Leading Credit Index™, in conjunction with other changes, makes the LEI a more accurate predictor of U.S. business cycles since 1990," said Ataman Ozyildirim, economist at The Conference Board. "The improvement is especially pronounced before and during the 2008-2009 recession, and during the current expansion. In December, the LEI for the U.S. increased again. The gain was widespread among the leading indicators, suggesting economic conditions should improve in early 2012. However, the LEI gain in December was held back by negative contributions from the new Leading Credit Index — which indicates weak credit and financial conditions — and from consumer expectations for business and economic conditions."
Added Ken Goldstein, economist at The Conference Board: "The CEI and other recent data reflect an economy that ended 2011 on a positive note and the LEI provides some reason for cautious optimism in the first half of 2012. This somewhat positive outlook for a strengthening domestic economy would seem to be at odds with a global economy that is losing some steam. Looking ahead, the big question remains whether cooling conditions elsewhere will limit domestic growth or, conversely, growth in the U.S. will lend some economic support to the rest of the globe." [See the full release here.]
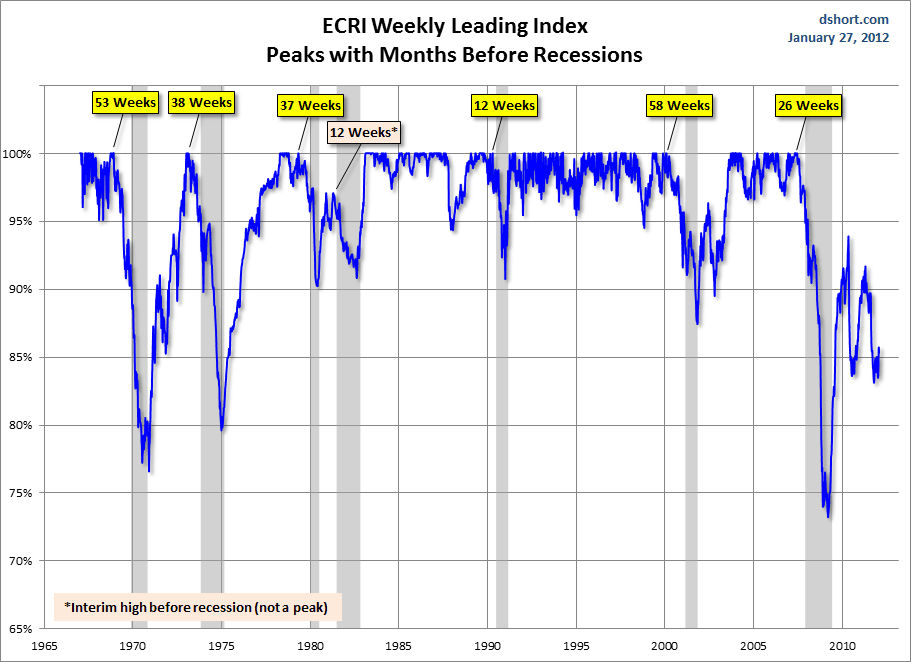
My purpose in this commentary is merely to illustrate the dramatic difference between the old and new LEI. In another commentary I take a closer look at the new LEI in comparison with ECRI's Weekly Leading Index.
- English (UK)
- English (India)
- English (Canada)
- English (Australia)
- English (South Africa)
- English (Philippines)
- English (Nigeria)
- Deutsch
- Español (España)
- Español (México)
- Français
- Italiano
- Nederlands
- Português (Portugal)
- Polski
- Português (Brasil)
- Русский
- Türkçe
- العربية
- Ελληνικά
- Svenska
- Suomi
- עברית
- 日本語
- 한국어
- 简体中文
- 繁體中文
- Bahasa Indonesia
- Bahasa Melayu
- ไทย
- Tiếng Việt
- हिंदी
The New Conference Board Leading Economic Index
Published 01/28/2012, 10:15 AM
Updated 07/09/2023, 06:31 AM
The New Conference Board Leading Economic Index
Latest comments
Loading next article…
Install Our App
Risk Disclosure: Trading in financial instruments and/or cryptocurrencies involves high risks including the risk of losing some, or all, of your investment amount, and may not be suitable for all investors. Prices of cryptocurrencies are extremely volatile and may be affected by external factors such as financial, regulatory or political events. Trading on margin increases the financial risks.
Before deciding to trade in financial instrument or cryptocurrencies you should be fully informed of the risks and costs associated with trading the financial markets, carefully consider your investment objectives, level of experience, and risk appetite, and seek professional advice where needed.
Fusion Media would like to remind you that the data contained in this website is not necessarily real-time nor accurate. The data and prices on the website are not necessarily provided by any market or exchange, but may be provided by market makers, and so prices may not be accurate and may differ from the actual price at any given market, meaning prices are indicative and not appropriate for trading purposes. Fusion Media and any provider of the data contained in this website will not accept liability for any loss or damage as a result of your trading, or your reliance on the information contained within this website.
It is prohibited to use, store, reproduce, display, modify, transmit or distribute the data contained in this website without the explicit prior written permission of Fusion Media and/or the data provider. All intellectual property rights are reserved by the providers and/or the exchange providing the data contained in this website.
Fusion Media may be compensated by the advertisers that appear on the website, based on your interaction with the advertisements or advertisers.
© 2007-2025 - Fusion Media Limited. All Rights Reserved.
