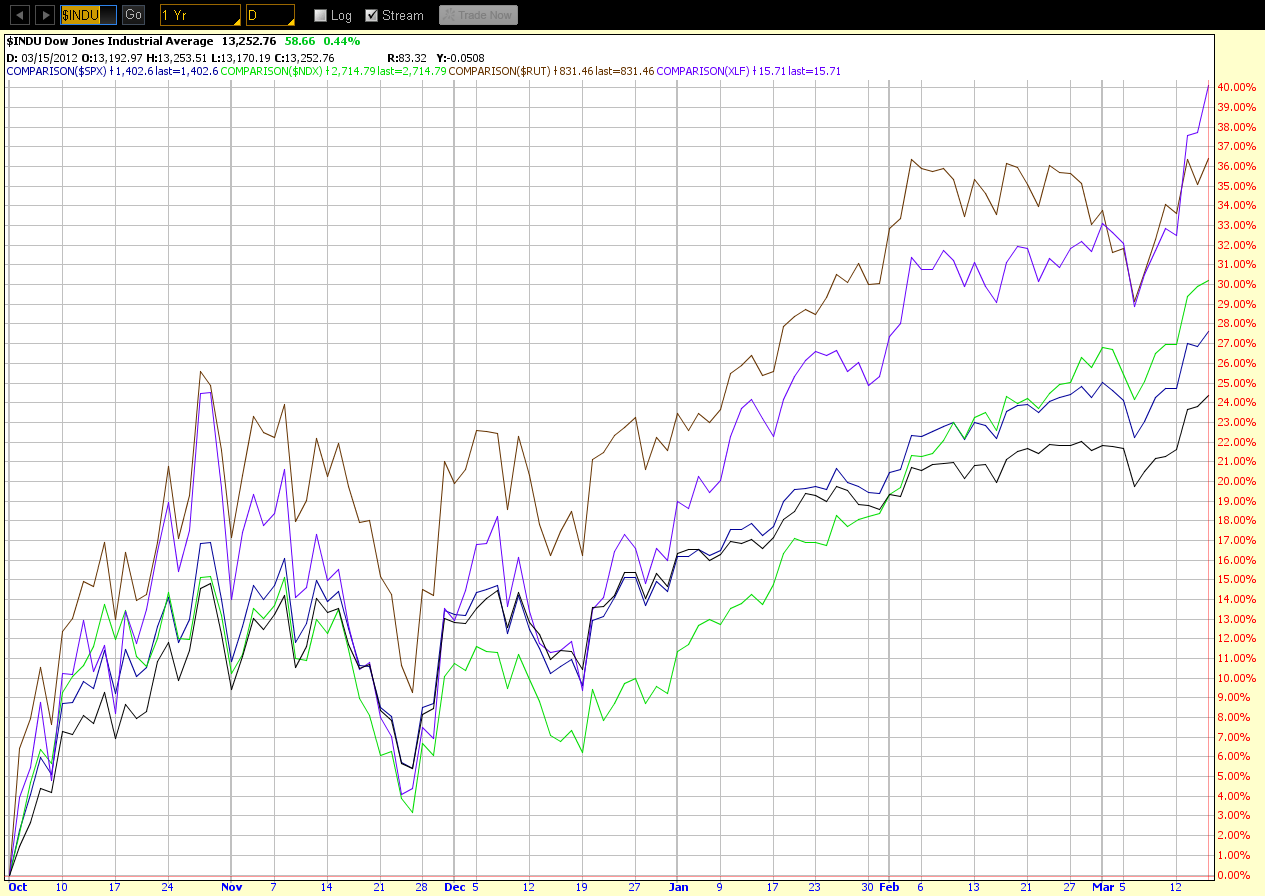
Below is a percentage comparison chart of the Dow 30, S&P 500, Nasdaq 100, and Russell 2000 Indices, and the Financials ETF (XLF). I've started it from the October 2011 lows.
As you can see, the Russell 2000 Index has been leading the advance from that point on a percentage-gained basis until the second-place XLF shot above it on March 13th.
The Russell 2000 has been, effectively, in a basing mode since February, but has been moving up from its low of last week and is now near the highs of this year. It had begun pulling further and further ahead of the other Major Indices from mid-December, and they have closed the gap to the point now where they have all been moving up "in tandem" from last week's lows.
If the Major Indices are going to continue a convincing rally from here, it will be important for the Russell 2000 to break (convincingly) and hold above its February highs to provide added fuel. Once that has happened, we can see where the leadership lies. A failed breakout could lead to the onset of weakness, not only in this index, but also in the others.
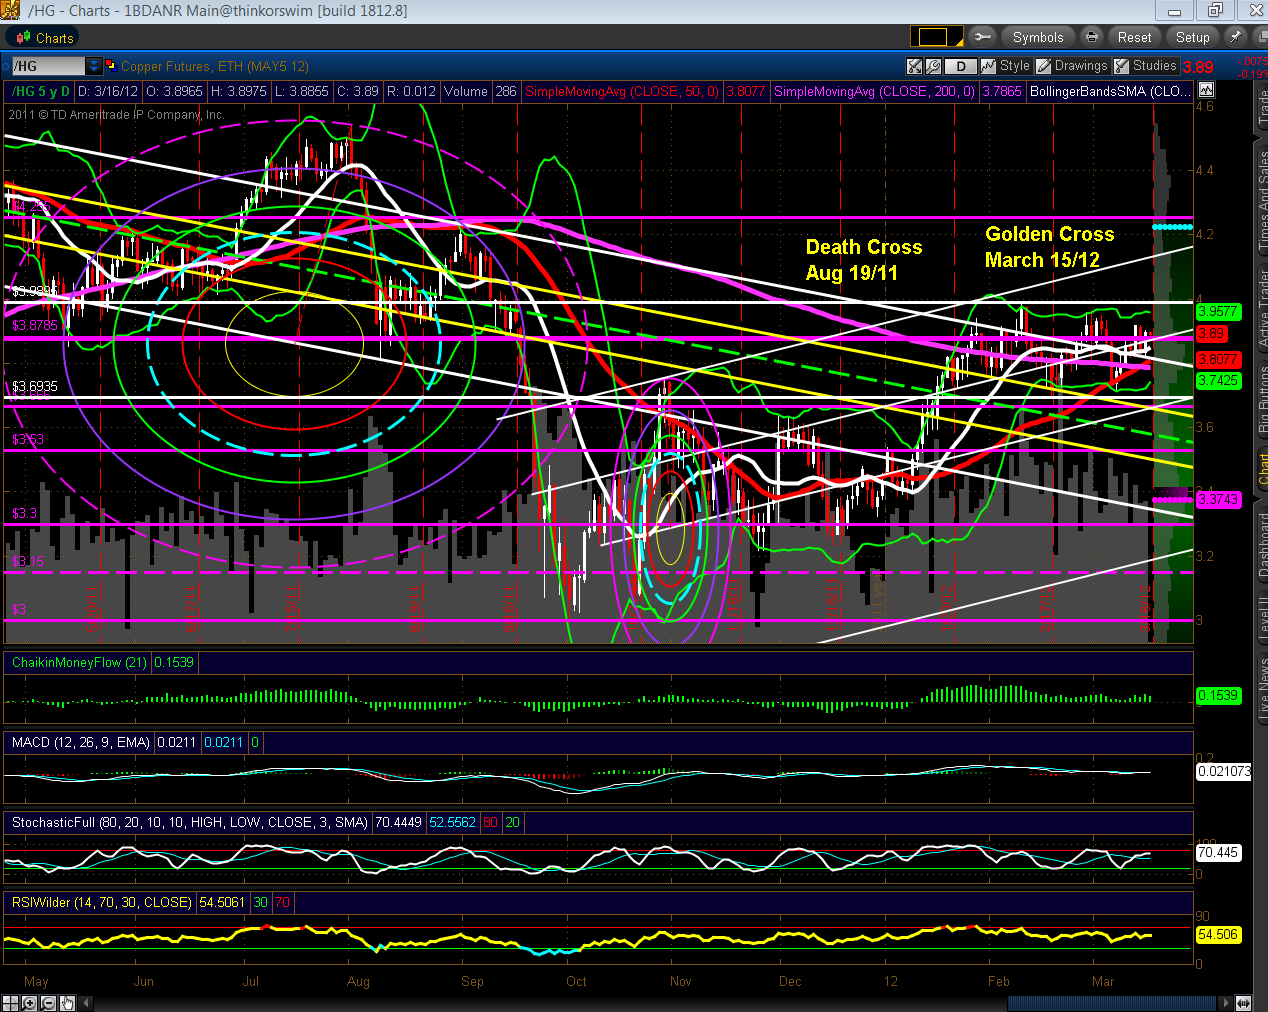
Thursday's bullish 50/200 sma Golden Cross on the Daily chart below of Copper may provide further fuel to such a rally. Copper is currently trading near the top of its range, which began in mid-January, and just above its previous Head & Shoulders neckline from 2011.
One to watch for a potential breakout, along with the Russell 2000 Index.
- English (UK)
- English (India)
- English (Canada)
- English (Australia)
- English (South Africa)
- English (Philippines)
- English (Nigeria)
- Deutsch
- Español (España)
- Español (México)
- Français
- Italiano
- Nederlands
- Português (Portugal)
- Polski
- Português (Brasil)
- Русский
- Türkçe
- العربية
- Ελληνικά
- Svenska
- Suomi
- עברית
- 日本語
- 한국어
- 简体中文
- 繁體中文
- Bahasa Indonesia
- Bahasa Melayu
- ไทย
- Tiếng Việt
- हिंदी
The Necessary Ingredient to Fuel This Rally
Published 03/16/2012, 03:55 AM
Updated 07/09/2023, 06:31 AM
The Necessary Ingredient to Fuel This Rally
Latest comments
Loading next article…
Install Our App
Risk Disclosure: Trading in financial instruments and/or cryptocurrencies involves high risks including the risk of losing some, or all, of your investment amount, and may not be suitable for all investors. Prices of cryptocurrencies are extremely volatile and may be affected by external factors such as financial, regulatory or political events. Trading on margin increases the financial risks.
Before deciding to trade in financial instrument or cryptocurrencies you should be fully informed of the risks and costs associated with trading the financial markets, carefully consider your investment objectives, level of experience, and risk appetite, and seek professional advice where needed.
Fusion Media would like to remind you that the data contained in this website is not necessarily real-time nor accurate. The data and prices on the website are not necessarily provided by any market or exchange, but may be provided by market makers, and so prices may not be accurate and may differ from the actual price at any given market, meaning prices are indicative and not appropriate for trading purposes. Fusion Media and any provider of the data contained in this website will not accept liability for any loss or damage as a result of your trading, or your reliance on the information contained within this website.
It is prohibited to use, store, reproduce, display, modify, transmit or distribute the data contained in this website without the explicit prior written permission of Fusion Media and/or the data provider. All intellectual property rights are reserved by the providers and/or the exchange providing the data contained in this website.
Fusion Media may be compensated by the advertisers that appear on the website, based on your interaction with the advertisements or advertisers.
© 2007-2025 - Fusion Media Limited. All Rights Reserved.
