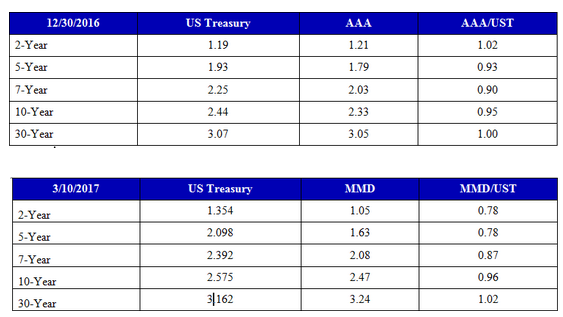
We are a week short of two months into the Donald Trump presidency. The story is told in the two charts below. We can see that Treasury yields have risen since yearend across the board, with short-term yields rising faster than long-term yields. This trend clearly anticipates the Federal Reserve rate hike this week.

What is more interesting is that the ratios of munis to Treasuries on the shorter end have moved down smartly since the beginning of the year. In our view this is the beginning of the recasting of the muni market to more traditional yield ratios versus US Treasuries. This trend starts at the front end of the curve because that is the part of the curve that is most susceptible to quicker upward movements as the Federal Reserve begins to raise short-term interest rates on a more regular basis. This doesn’t mean the FOMC will be raising rates at every Fed meeting, as we witnessed in the 2004–2006 period. But in a world where short-term rates are rising, it’s very clear that tax-free rates should rise only about 75% as much because of the value of the tax exemption.
The front of the curve has now corrected to appropriate ratio levels. We expect that the curve will adjust more slowly over the rest of the year, but we do think it adjusts.
Let’s look back to what the two markets looked like in March 2005, twelve years ago. The Fed had been raising the fed funds target consistently since January 2004. They started at 1%. By March 2005 the fed funds target rate had been raised to 2.5%, on its way to 5.25% in July 2005. What did the high-grade muni market and Treasury market look like a year and a quarter into the rate hikes?

We fully expect that over time, the intermediate and longer end of the municipal bond market will adjust. This means that longer tax-free bonds rated “AA” or better quality that we are buying at yields from 4.0% to 4.2% (average of a 130% yield ratio to Treasuries) should prove to a bulwark even if the Treasury curve ends somewhat higher. In other words, the cheapness of the long end of the bond market provides a buffer against higher rates.
We also see municipal bonds remaining tax-exempt. And though there may be a cut in the marginal federal tax rate from 39.6% to 33%, the average tax bracket of 25% for all individual holders of municipal bonds should not move very much. If you factor in current proposals in the House of Representative to limit interest deductions to primary home mortgages, then municipal bonds should remain one of the few vehicles by which individuals can shelter income from federal taxes. And at current yield ratios well over 100%, munis are priced almost as if there were no taxation on yields.
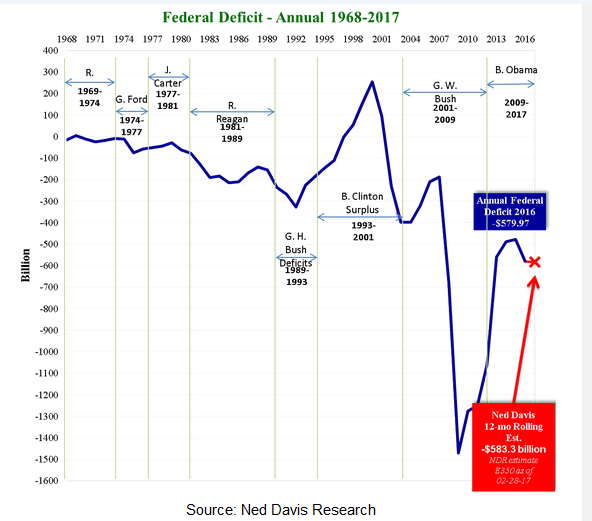
We don’t know what the scope of any infrastructure programs will be. We do feel that Congress, given its many fiscally conservative members, will lend itself to some amount of infrastructure spending but probably not to the point of taking the US annual deficit above $1 trillion. Below is a graph showing the US deficit. Note the drop in the deficit since the end of 2012. This dip is due both to the growth in government revenue from higher tax rates and to the drop in government spending due to sequestration. The deficit has started to level off at around $500–$600 billion.

In addition to the above factors, we feel that muni new-issue supply should end up being less than least year’s, for the simple reason that so much of last year’s supply was to advance refund older bonds. The rise in interest rates has made many refinancings less attractive at the margin and removed other refinancings from the market until nominal rates are much lower.
Summarizing, we believe that tax-free bond yields have started to correct vis-à-vis US Treasury yields and that the Federal Reserve hiking cycle will keep this process moving forward. A lower overall muni supply and Congressional inertia with regards to spending programs should also help in sending muni yields back to historically lower ratios as we move into the balance of the year.
