Thanks to geopolitical events, the markets sold off this week. There was sufficient technical damage to change the market’s currently bullish sentiment.
Let’s start with several 5-minute charts:
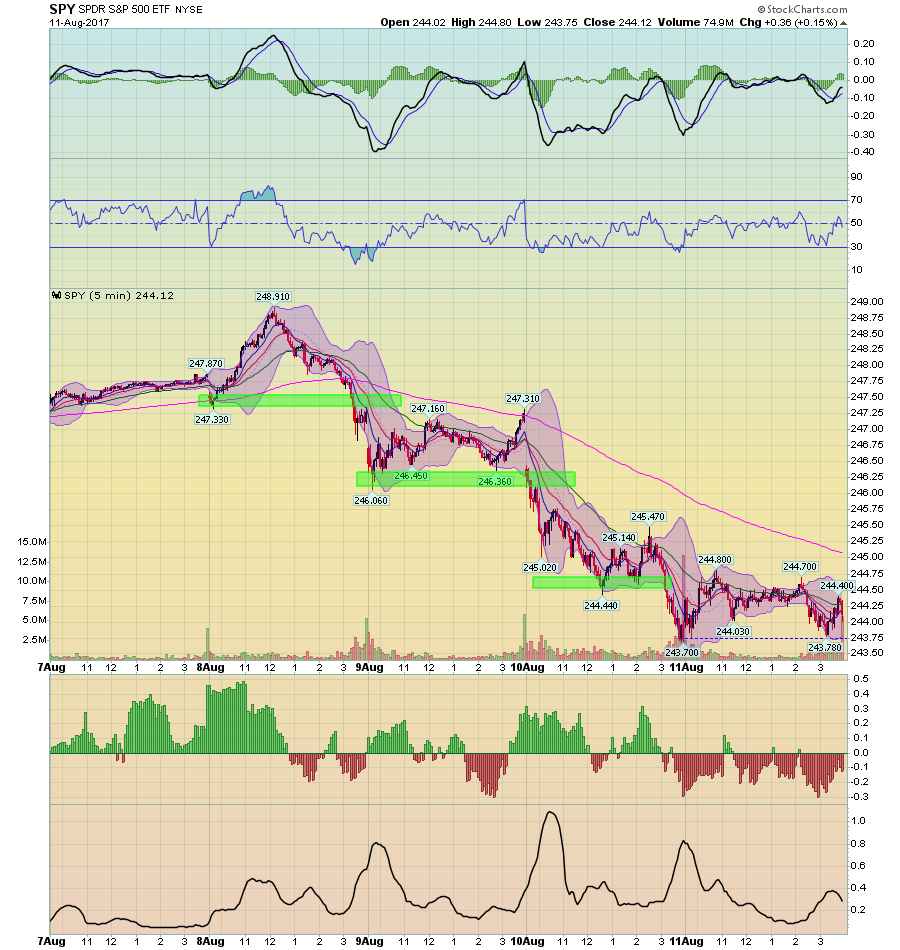
The SPDR S&P 500s (NYSE:SPY) were in a clear downtrend Tuesday through Thursday, as they continually broke through short-term technical support levels. On Friday, they traded between 243.7 and 244.8, consolidating losses.
In a clear flight to safety, the treasury market rallied:
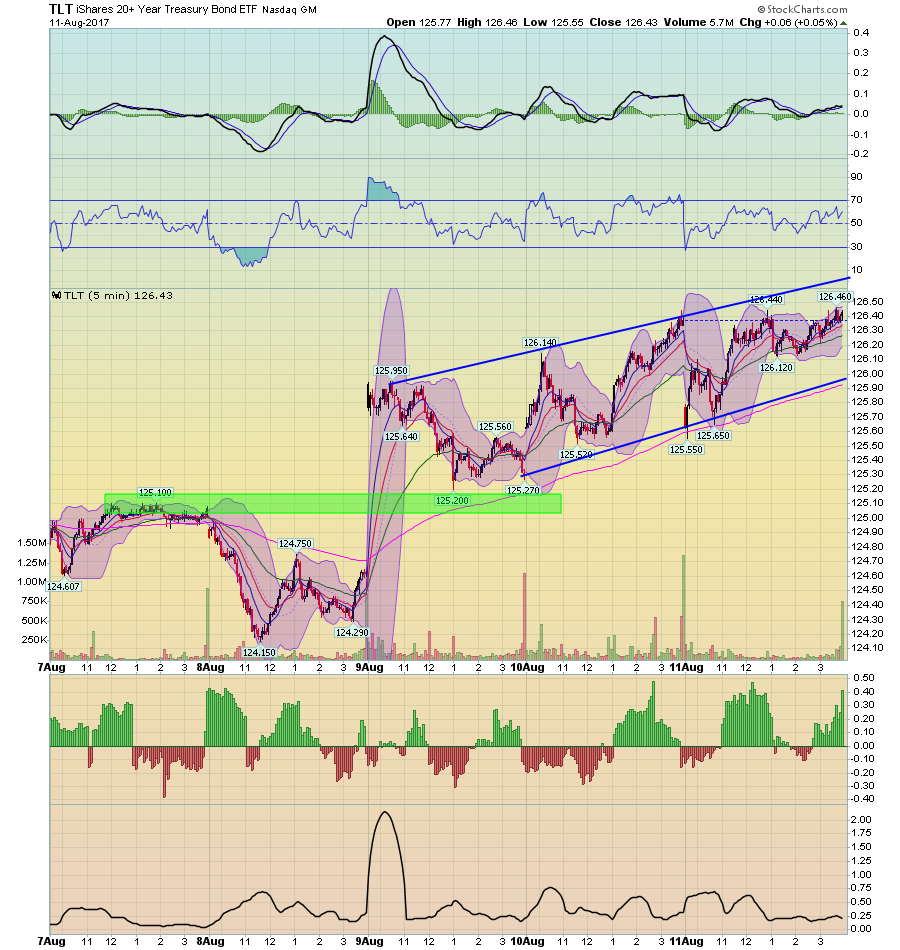
The iShares 20+ Year Treasury Bond (NASDAQ:TLT) - which represent the long end of the treasury curve – gapped higher at the open of trading on Wednesday, continuing in an upward trending channel for the rest of the week.
Let’s place these weekly charts into a month-long perspective:
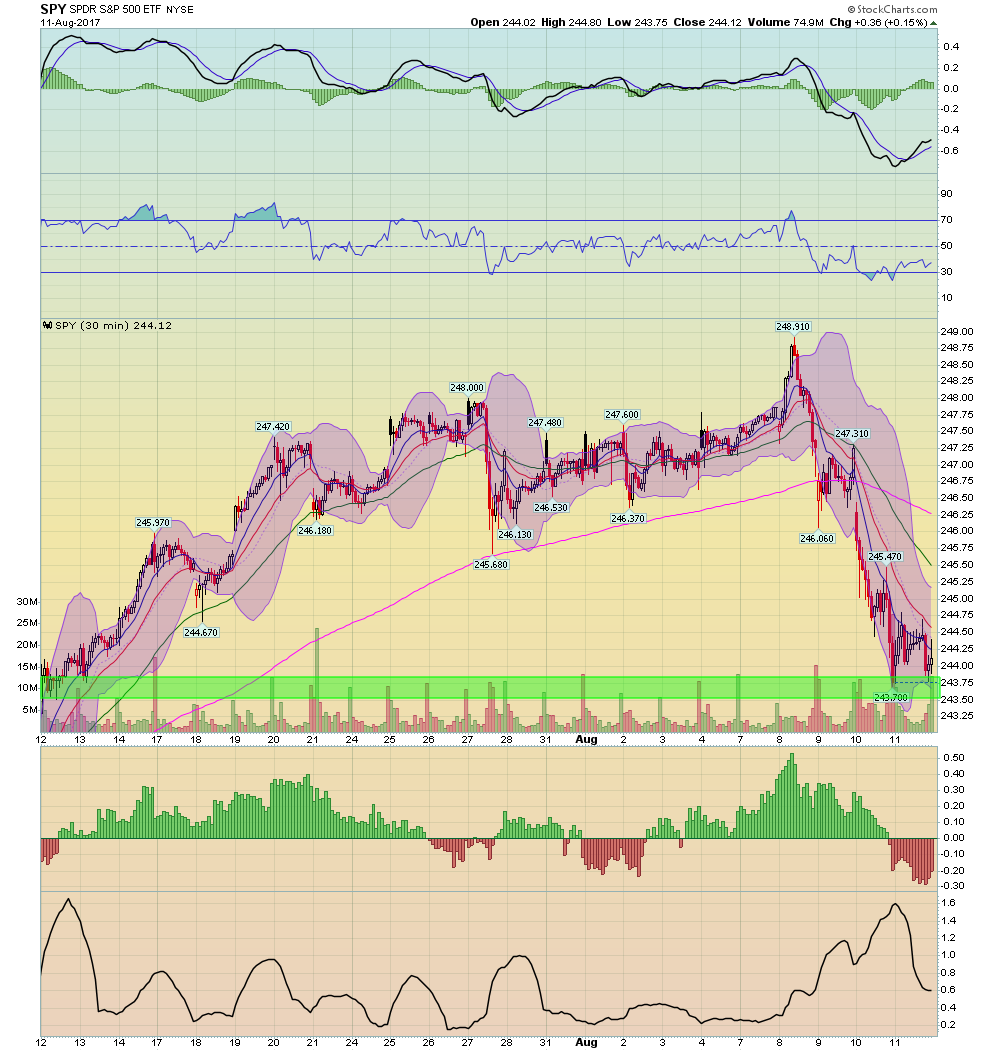
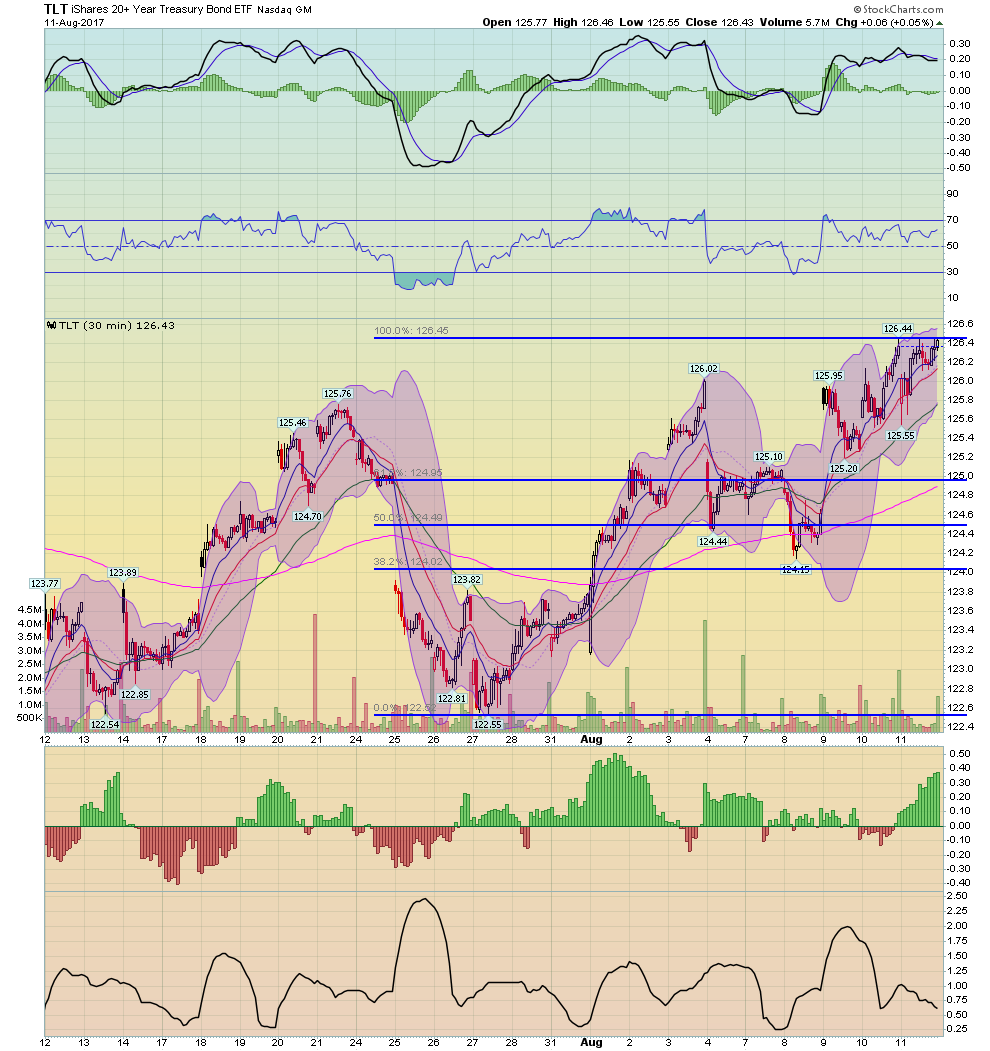
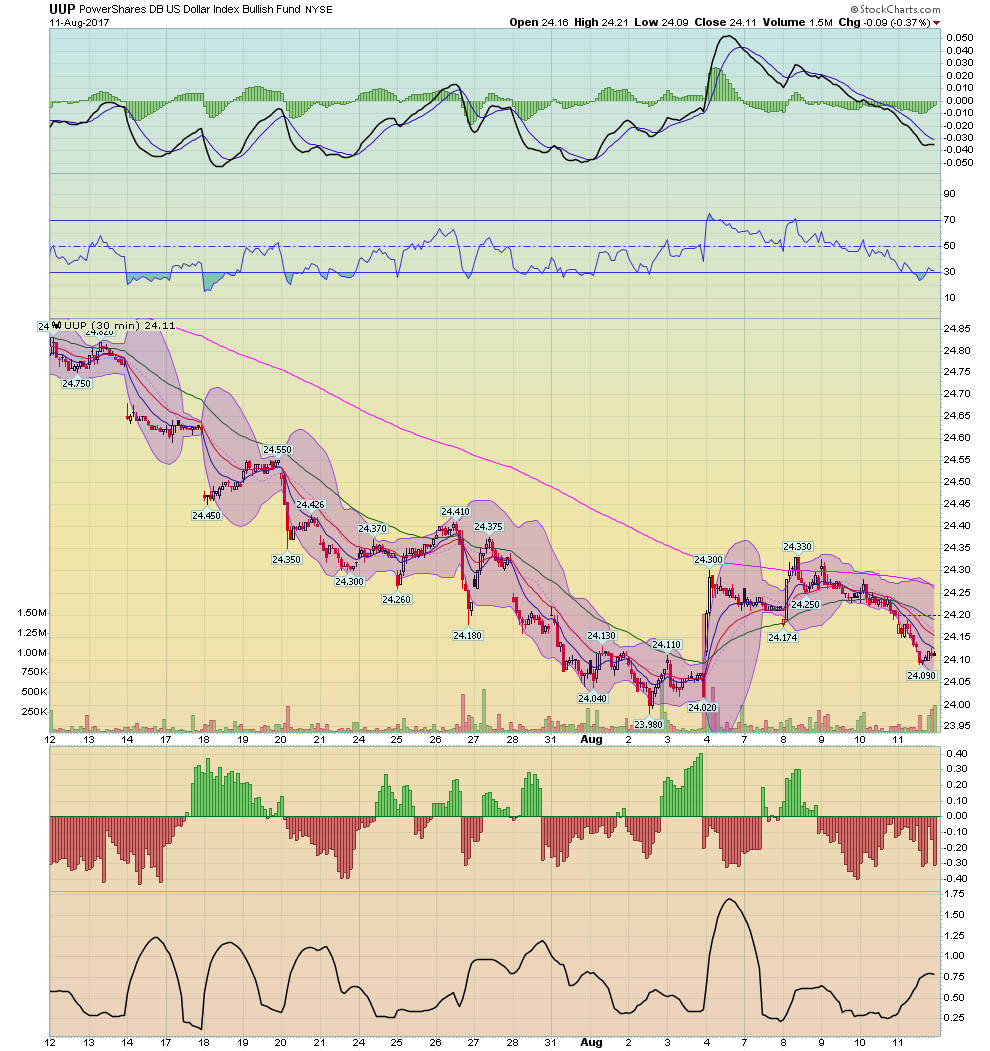
The top chart shows the one-month SPY (NYSE:SPY) chart in 30-minute increments. Last week’s selloff eliminated all gains from the month. The middle chart shows that the TLT’s have been moving higher since the end of July. The bottom chart illustrates that the dollar continues to move lower.
But the daily charts show the real technical damage:
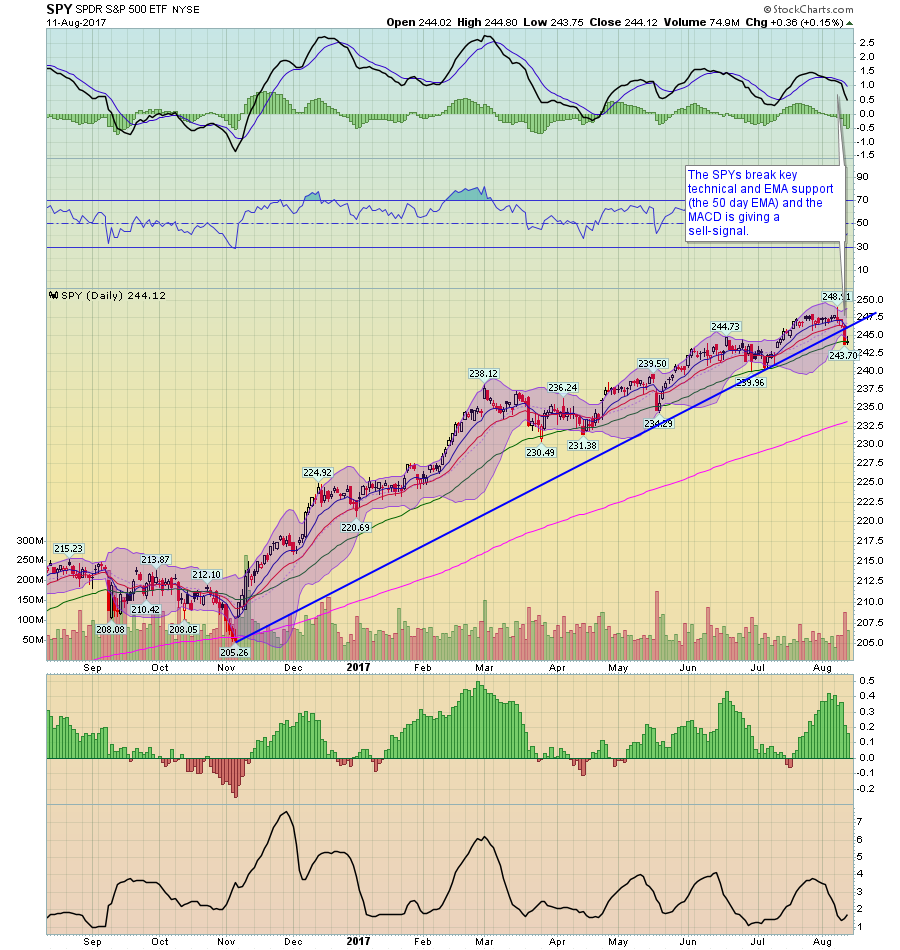
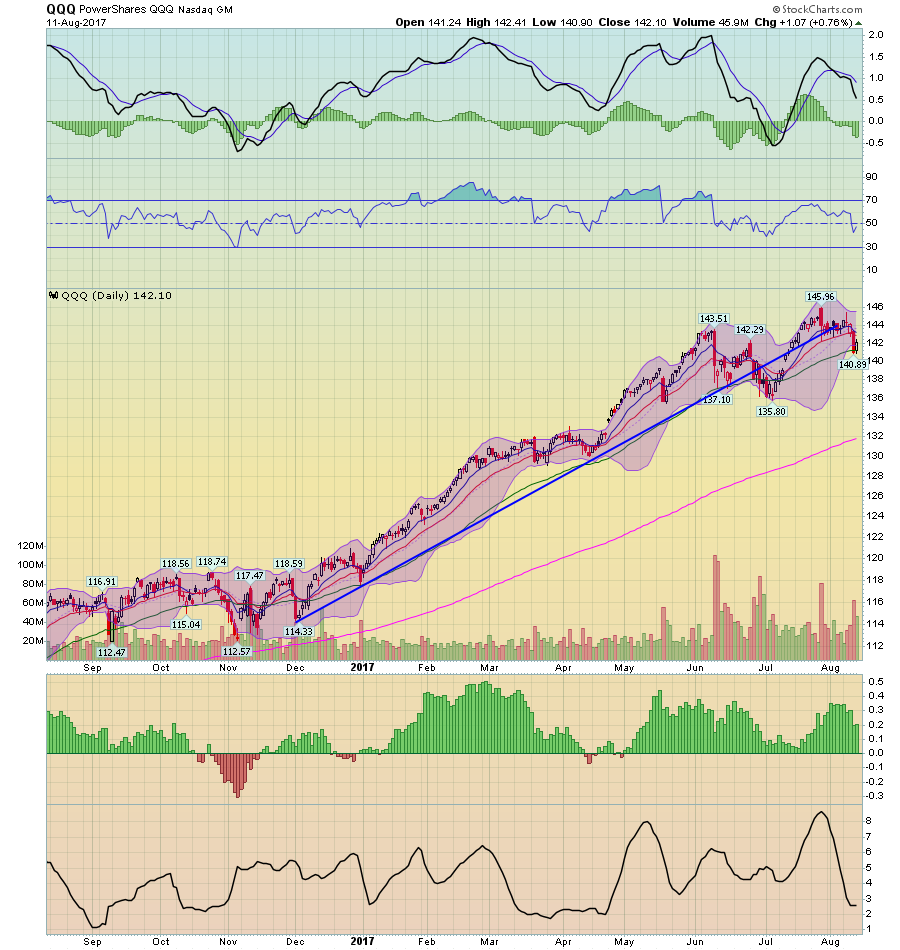
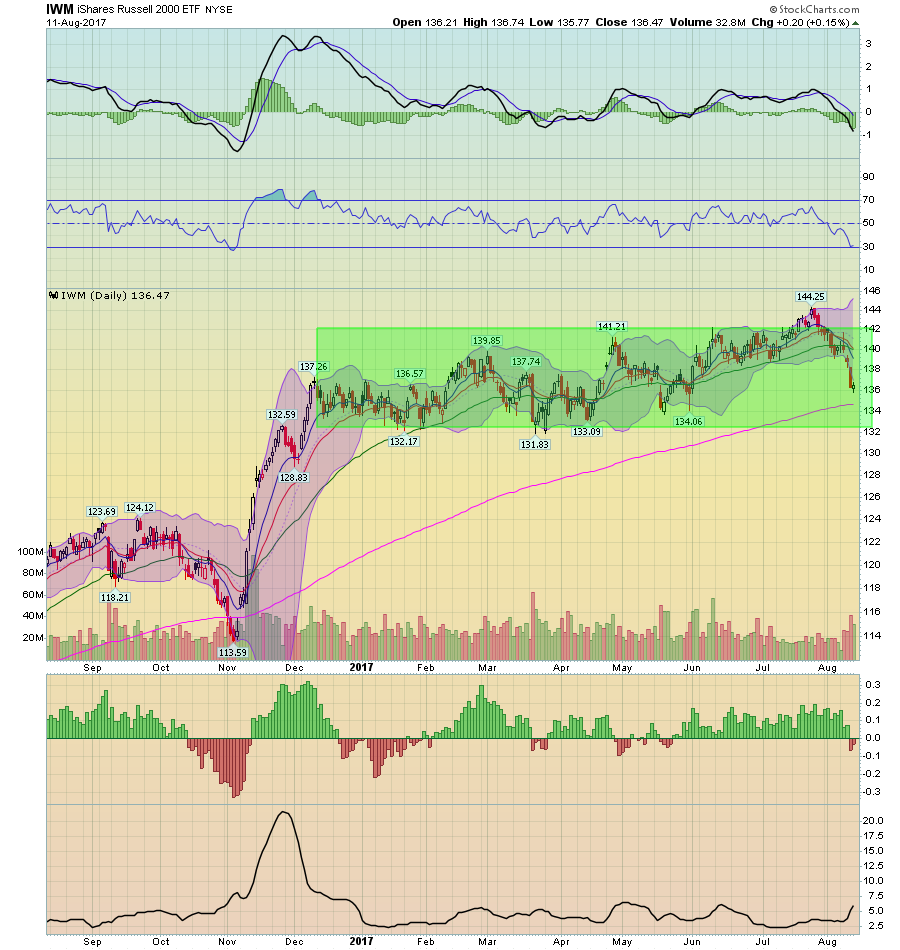
The top chart shows that the SPYs broke through the trendline connecting early November’s lows with those of early July. Prices also broke through the 50-day EMA on Thursday and currently remain at that level. The MACD has given a sell signal. The PowerShares QQQ Trust Series 1 (NASDAQ:QQQ) (middle chart) have additional technical damage. Prices originally broke support in late June, when they also fell through the shorter EMAs. They rallied until the end of July after which they sold off for a second time. Prices are currently below the long-term trend line connecting lows of early December and late June and are right at the 50-day EMA. The IWMs (bottom chart) have been telegraphing a weaker market environment for the last few months as they have moved sideways rather than joining the rest of the market’s rally. They are currently below all their shorter EMAs and are targeting the 200-day EMA for support.
Had the market focused exclusively on economic information, it’s doubtful we would have seen a selloff. Corporate earnings have been very strong and inflation has been weak, which supports the idea that the Federal Reserve will probably hold off on rate hikes at the next few upcoming meetings. Should geopolitical tensions calm down, the market will probably change its focus back to economics and at least consolidate losses at or near current levels. But in the short term, it appears that the U.S. is and Korea’s saber rattling will dictate market actions.
