Summary
- International data remains soft.
- U.S. price data is pro-rate cut; coincidental data was good.
- The rally remains suspect; Treasuries are still rallying and smaller-cap indexes are underperforming.
International Data Releases of Note
EU/U.K./Canada
U.K.
- Rolling GDP at .3%
- Production output is down 2.7% M/M
- UK unemployment at 3.8%
Canada
- Value of building permits up 24%
EU
- Industrial production down .5%
EU/UK/Canada conclusion: This is the week Brexit came home to roost. Production dropped sharply thanks to manufacturing weakness, and GDP continued to soften. This is filtering out into the EU, which saw its industrial production move lower.
Emerging Markets/Asia/Australia
Emerging Markets
- Mexican industrial production declined 2.86%
- Brazil retail sales increased by 1.7%
- Indian industrial production up 3.4% Y/Y
South Korea
- Unemployment at 4%
Australia
- Westpac leading index shows below trend growth
- Westpac consumer sentiment is modestly weak
- Australian business sentiment is one point above its historical average
- Unemployment at 5.1%
Japan
- Machinery orders up 5.2% M/M
- PPI at .7% Y/Y
- Industrial production declined 1.1%
China
- Car sales down 16.4% Y/Y
- CPI Inflation at 2.7% Y/Y
- Producer prices at .6% Y/Y
- Capital investment grew 5.6% Y/Y
- Industrial production grew 5% Y/Y
- Retail sales increased by 8.6% Y/Y
EM/Asia/Australia conclusion: The data continues to be very soft. Chinese car sales continue to contract; capital investment, industrial production, and retail sales continue to moderate. This weakness is spilling out into the region: Japanese industrial production has declined; Australian data (which is heavily dependent on China) is moderating.
Central Bank Actions of Note
Russia lowered rates 25 basis points to 7.5%. Here is the relevant part of their statement (emphasis added):
On 14 June 2019, the Bank of Russia Board of Directors decided to cut the key rate by 25 bp to 7.50% per annum. Annual inflation slowdown is continuing. In May, households’ inflation expectations and business price expectations did not materially change and remain elevated. Economic growth in the first half of 2019 is lower than the Bank of Russia’s expectations. Short-term proinflationary risks have abated compared to March. In these circumstances, in line with the pursued monetary policy, the Bank of Russia has lowered its end-of-year annual inflation forecast for 2019 from 4.7-5.2% to 4.2-4.7%. Moving on, according to the Bank of Russia’s forecast, annual inflation will stay close to 4%.
Russian growth dropped to a .5% rate in 1Q19. Business is in fair shape. Manufacturing PMI was negative in the latest report and industrial production is fluctuating, largely due to manufacturing issues. Services PMI is positive but has weakened over the last few months. While unemployment is low (4.7%), retail sales recently weakened. Inflation has increased to slightly over 5% but appears to have leveled off.
US Data Releases of Note
This week was all about prices, starting with the BLS's Tuesday release of PPI, which shows the prices used by purchasers of goods like manufacturers. These prices typically fluctuate at higher year-over-year percentages and are also more likely to be absorbed by businesses rather than being passed on as higher prices to end users. Here's the table from the release: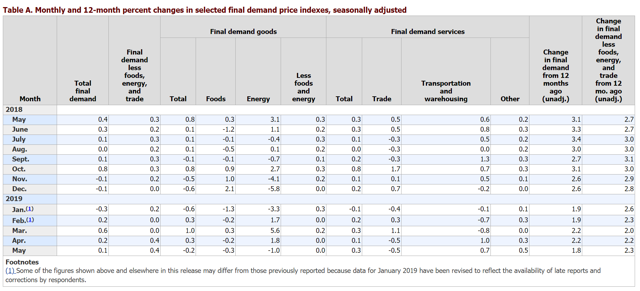
The column second from the right shows overall PPI, while the far-right column shows PPI less food and energy. The former is 1.8% while the latter is 2.3%. Although both rose in mid-2018 they are now declining.
The BLS released CPI on Wednesday (emphasis added):
The Consumer Price Index for All Urban Consumers (CPI-U) increased 0.1 percent in May on a seasonally adjusted basis after rising 0.3 percent in April, the U.S. Bureau of Labor Statistics reported today. Over the last 12 months, the all items index increased 1.8 percent before The all items index increased 1.8 percent for the 12 months ending May.
The index for all items less food and energy rose 2.0 percent over the last 12 months, and the food index also rose 2.0 percent. The energy index decreased 0.5 percent over the past year. seasonal adjustment.
Here's a chart of the CPI data:
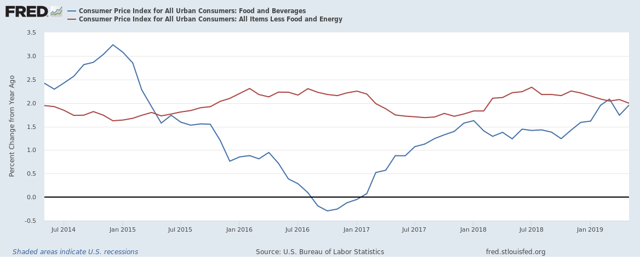
Core CPI (above in red) has consistently printed in the 2%-2.5% range for the last five years. Overall CPI - as always - has risen and fallen in conjunction with oil prices. But it was over 3% in 2014 and has since been low and contained.
Finally, we have import prices (emphasis added):
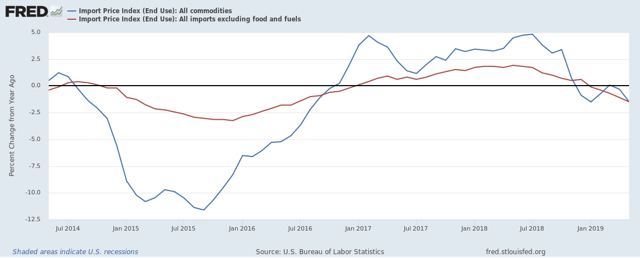
U.S. Import prices fell 0.3 percent in May, the first monthly decline since a 1.4-percent drop in December. Import prices advanced 1.8 percent from December to April before the downturn in May. The price index for overall imports decreased 1.5 percent over the past 12 months, matching the drop in January. These were the largest over-the-year declines since the index fell 2.2 percent in August 2016.
Here's a chart of import price data:
Import prices are contracting on a Y/Y basis and have been since the end of last year.
Prices conclusion: Price stability is half of the Federal Reserve's mandate. The above data indicates that prices are contained, giving the Fed no reason to argue that inflationary pressures are forcing their hand to raise rates.
Two other coincidental numbers were released this week. Industrial production rose .4%. Here's the table from the release:
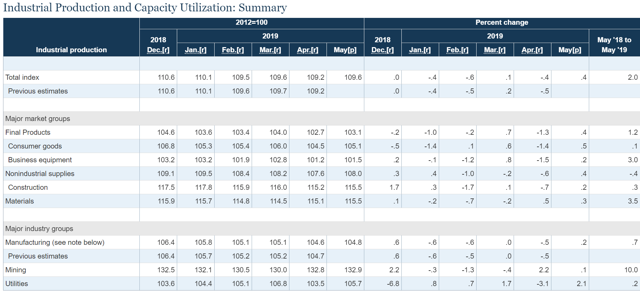
This is the strongest gain in six months. All subcategories of data rose: All major market groups were up (middle panels), as were all major industry groups. One can quibble with the amount of the gain, but there's no denying that overall this is was a good report.
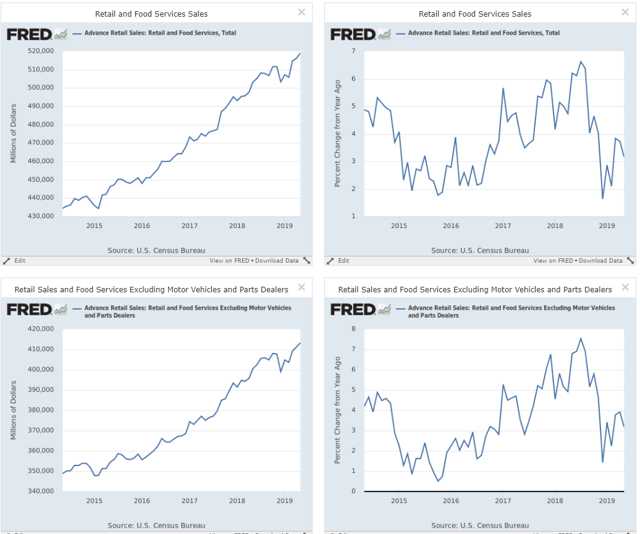
Retail sales increased .5%. The charts show the general trend:
The top two charts show total retail sales; the bottom two charts show retail sales ex-autos. The left charts show the absolute level while the right charts show the year-over-year percentage gain. Both absolute numbers fell at the end of last year as a result of the falling stock market and government shutdown. Both have since rebounded. The year-over-year numbers for both also dropped at the end of last year but both are now rising. Overall, the latest report was good news, showing a confident consumer.
U.S. Markets Review
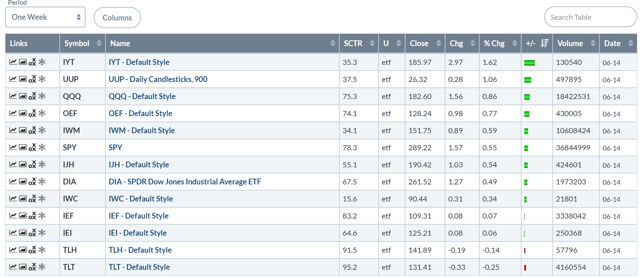
Let's turn to this week's performance table:
The indexes were up modestly, but the gains could easily be described as statistical noise. The PowerShares QQQ gained .86%, the SPDR S&P 500 (NYSE:SPY) was up .55% and the Treasury market was off modestly. Overall, not much happened.
When this rally started, I wrote that I needed to see two things to be sold on its long-term viability: a Treasury market sell-off to previously established support levels and micro- and small-cap rally above their respective 200-day EMAs. Neither has happened.
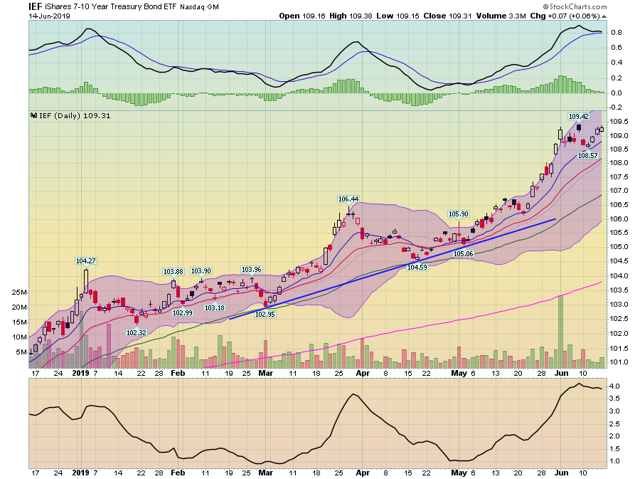
The iShares 7-10 Year Treasury Bond ETF (NYSE:IEF) rallied during the spring at a modest but consistent pace. The rally gained steam in late May. Prices have consolidated sideways in early June, trading between the $108 and $109.5 level. The EMAs are bullishly aligned (the shorter are above the longer and all are moving higher). There is no indication that the IEF is going to sell off anytime soon.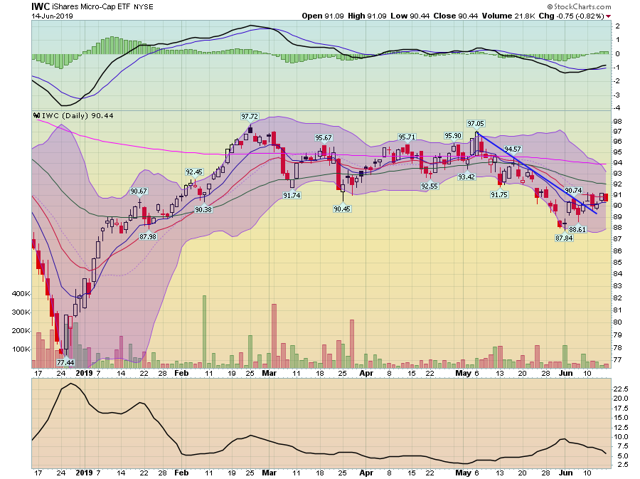
Micro-caps broke through resistance in early June but have barely made an advance since. Prices are meandering sideways; they're currently trapped between the 10- and 20-day EMAs. Especially important is that the 200-day EMA is moving slightly downward, indicating a bearish trend.
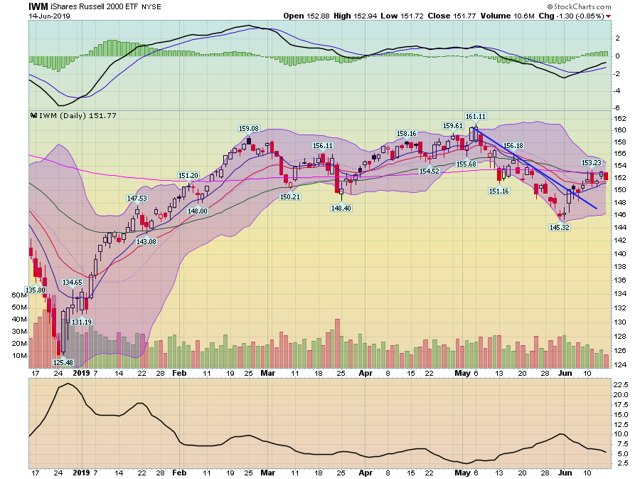
The iShares Russell 2000 Index's IWM rally is a bit better. However, it is still below the 200-day EMA.
The financial markets continue to signal that they believe the economy is close to a recession: Treasuries are rallying in anticipation of a rate cut; large-caps are rallying because they are more able to sustain earnings during a slowdown (while also paying dividends and buying back shares), and small caps are underperforming because they will grow at a slower rate in a slower economy.

