Summary
International Economic Data
Normally, I divide the data along geographic lines. As this was a very light week of data, I'll simply list the key developments by country.
There was insufficient data from any region to draw a meaningful conclusion.
Central Bank Actions of Note
The Mexican Central Bank lowered rates 25 basis points to 7.75%. Here is how they described the economy:
Although economic activity in the previous quarters and in July remained stagnant, it is expected to recover slightly over the rest of the year. Slack conditions in the economy during the early part of the quarter remained at levels similar to those of the previous one, with a persistent negative output gap. In an environment of significant uncertainty, the balance of risks for growth remains biased to the downside.
The Mexican economy is slowing. GDP has declined from 2.6% in 1Q18 to a .8% decline in 2Q19. Although unemployment is trending higher, it is still a very low 3.4%. This is supporting a 2.1% Y/Y increase in retail sales. However, manufacturing is weak: the manufacturing PMI has been below 50 in four of the last six months, while industrial production has declined on a Y/Y basis in eight of the last nine months.
US Economic Data
On Thursday, the BEA released the final estimate of 2Q GDP:
Real gross domestic product (GDP) increased at an annual rate of 2.0 percent in the second quarter of 2019 (table 1), according to the "third" estimate released by the Bureau of Economic Analysis. In the first quarter, real GDP increased 3.1 percent.
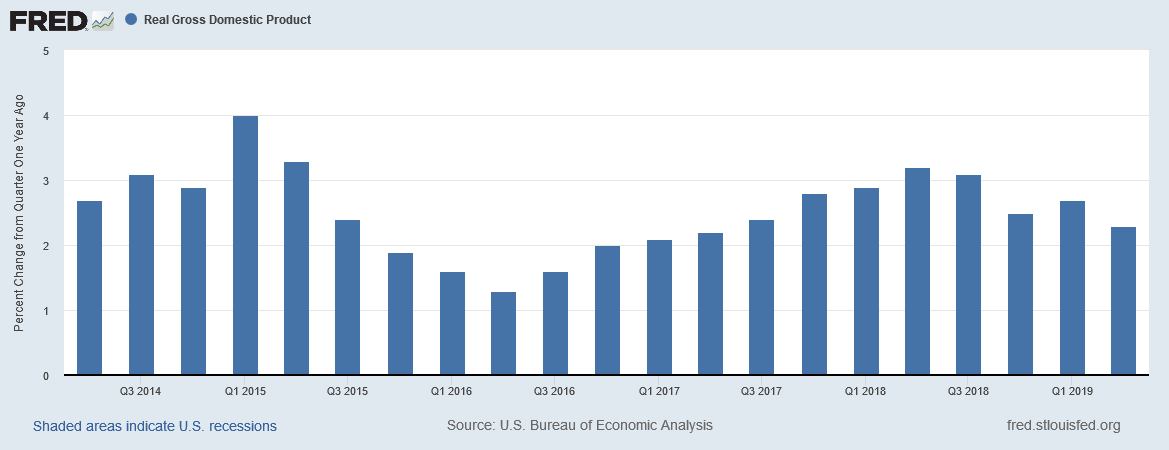
Let's work through the report's data, starting with the Y/Y percentage change in GDP:
The pace of the Y/Y increase rose between 3Q16-2Q18, finally printing above 3% in the second and third quarter of 2018. The rate of increase has decreased since, but overall the economy is still growing at a modest pace.
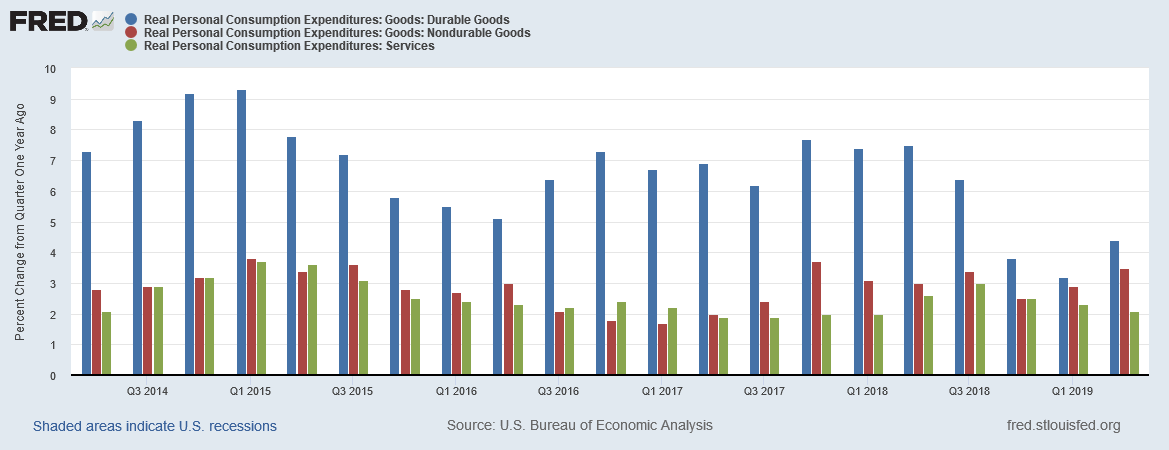
Consumers are spending at a solid rate. The Y/Y percentage change durable goods (in blue), non-durable goods (in red), and services (in green) are still rising at a pace that will support modest growth.
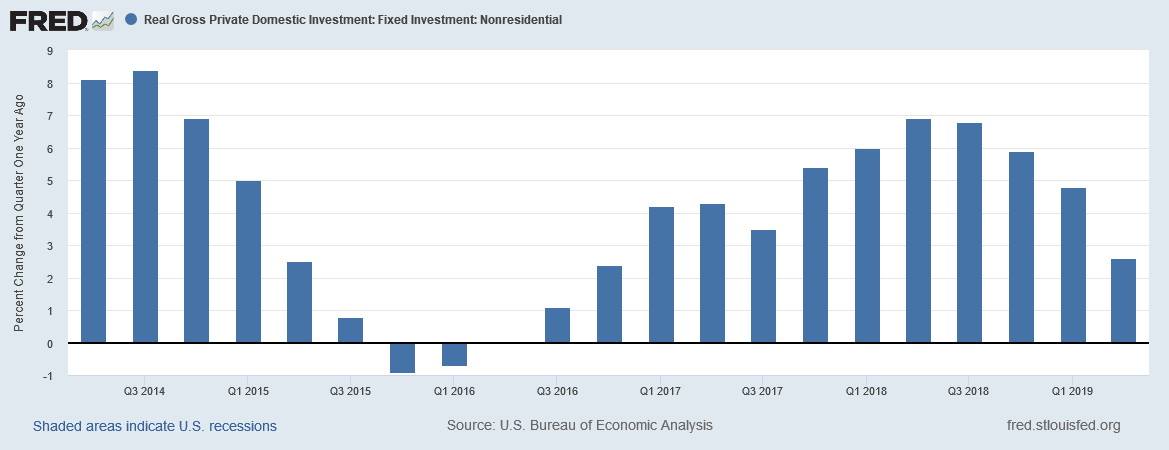
However, the pace of increase in business investment is declining (please see yesterday's market recap for additional detail).
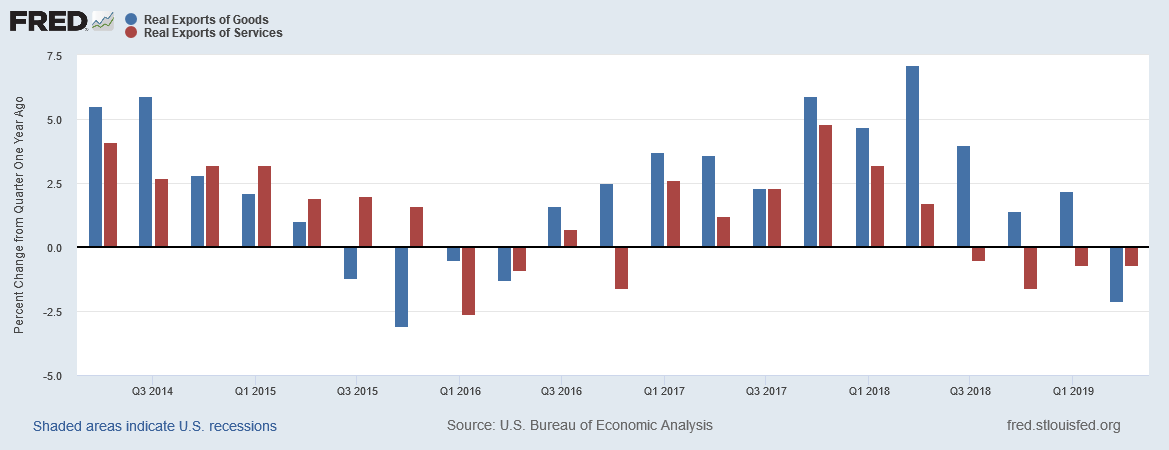
And finally, exports are hurting.
On Friday, the BEA released the latest personal spending data:
Personal income increased $73.5 billion (0.4 percent) in August according to estimates released today by the Bureau of Economic Analysis. Disposable personal income (DPI) increased $77.7 billion (0.5 percent) and personal consumption expenditures (PCE) increased $20.1 billion (0.1 percent).
Real DPI increased 0.4 percent in August and Real PCE increased 0.1 percent. The PCE price index increased less than 0.1 percent. Excluding food and energy, the PCE price index increased 0.1 percent.
The spending data is solid:
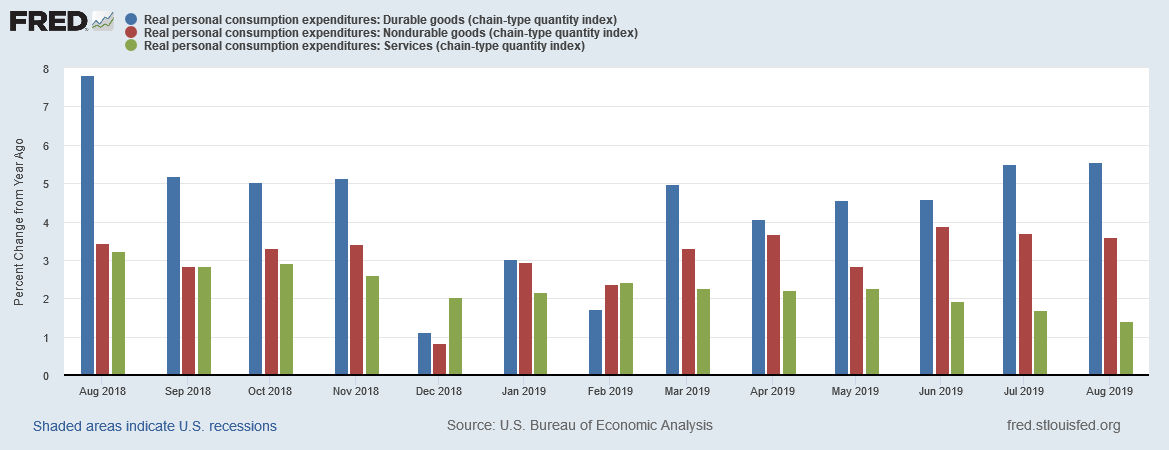
The above chart shows the preceding 12 months of the Y/Y percentage change in PCEs for durable goods, nondurable goods, and services. All are expanding at solid rates.
We now have a complete set of new data for the housing market. The overall backdrop is mostly positive: unemployment is low, and mortgage rates have dropped over 120 basis points in the last nine months. But inventory is constrained and, most importantly, prices are still high.
Let's start with new home sales (emphasis added):
The U.S. Census Bureau and the Department of Housing and Urban Development. This is 7.1 percent (±20.3 percent)* above the revised July rate of 666,000 and is 18.0 percent (±19.9 percent)* above the August 2018 estimate of 604,000.
Here's a chart of sales and inventory:
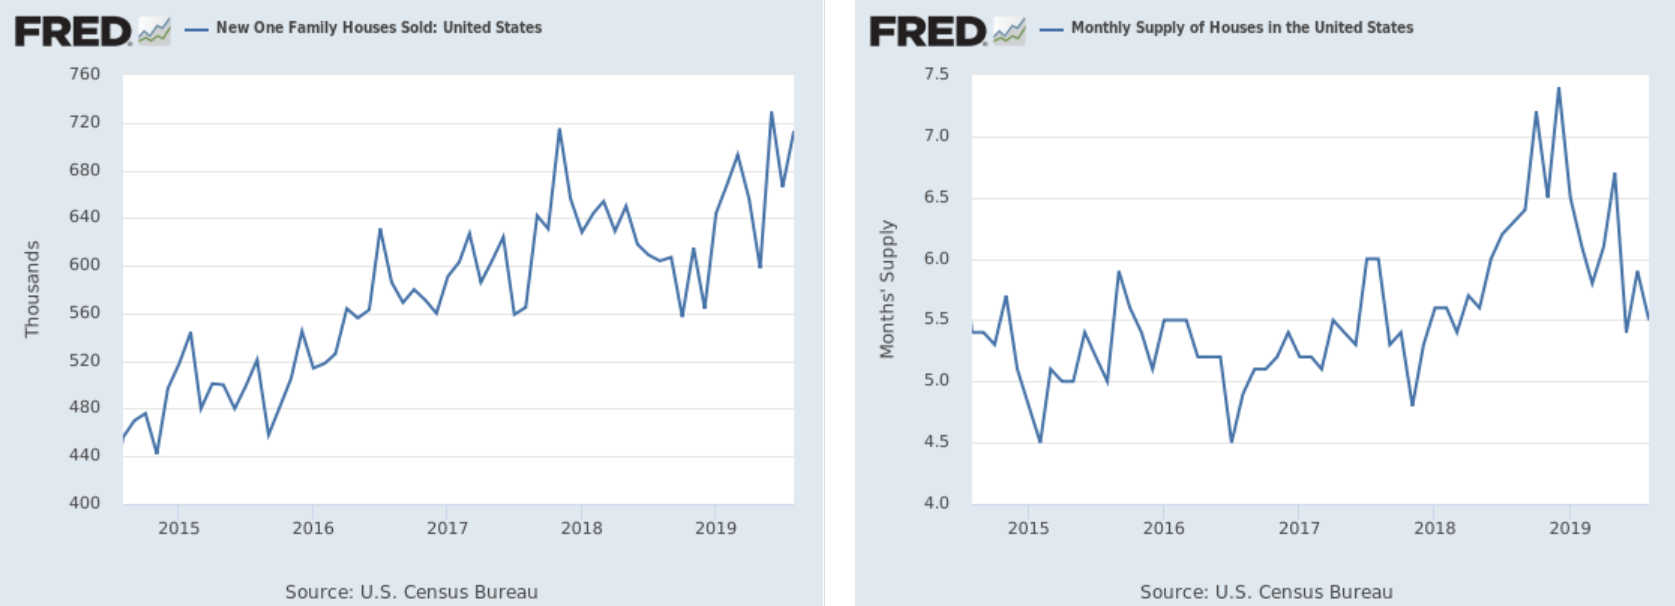
Total sales are on the left, inventory is on the right. Sales ticked higher over the last 4-6 months and are now near 5-year highs. This increased activity has depleted inventory. The data shows that low rates are probably having a positive impact on activity.
Existing home sales are also higher (emphasis added):
Total existing-home sales1, completed transactions that include single-family homes, townhomes, condominiums and co-ops, rose 1.3% from July to a seasonally adjusted annual rate of 5.49 million in August. Overall sales are up 2.6% from a year ago (5.35 million in August 2018).
Here are two charts of the data:
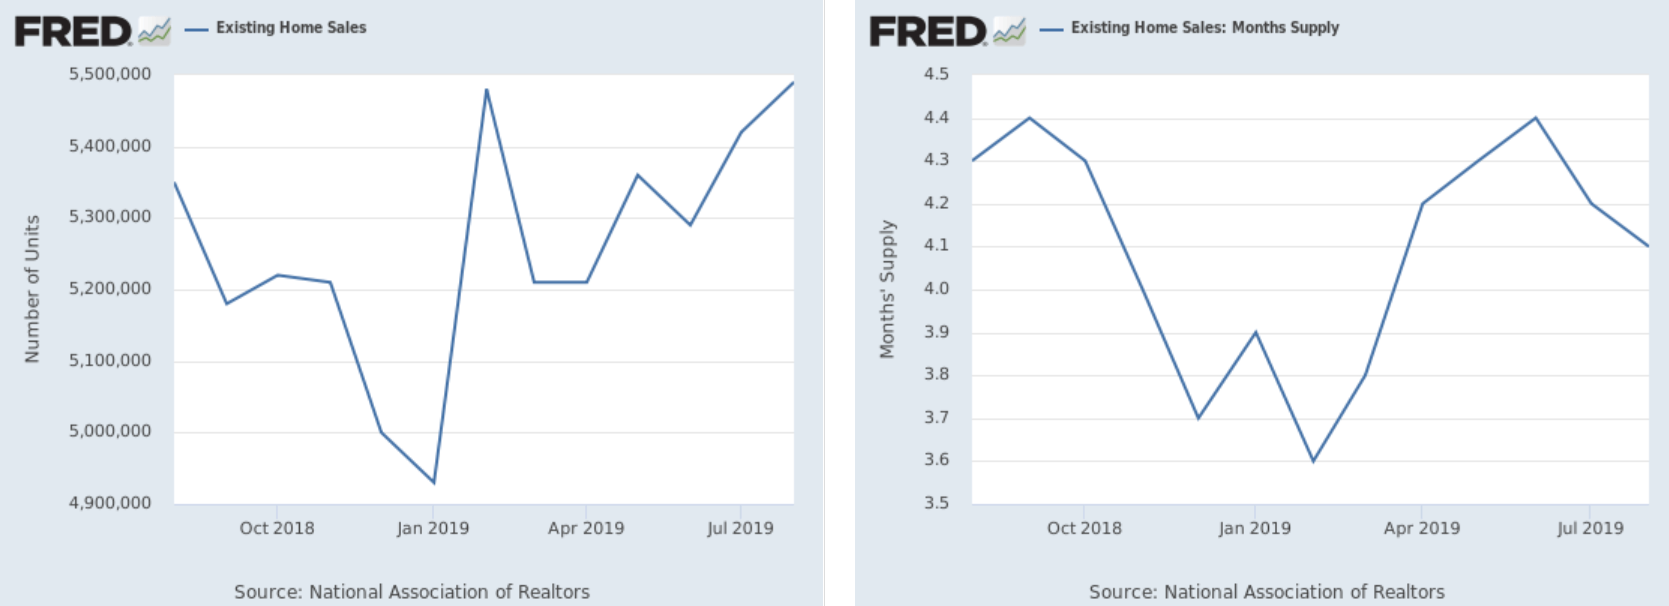
Total sales are at a one-year high, while inventory has dipped a bit.
Overall, housing appears to be in good shape. The best part is that the industry has learned from the mistakes of the housing bubble, which means lending has been contained and new home building is too slow instead of too fast.
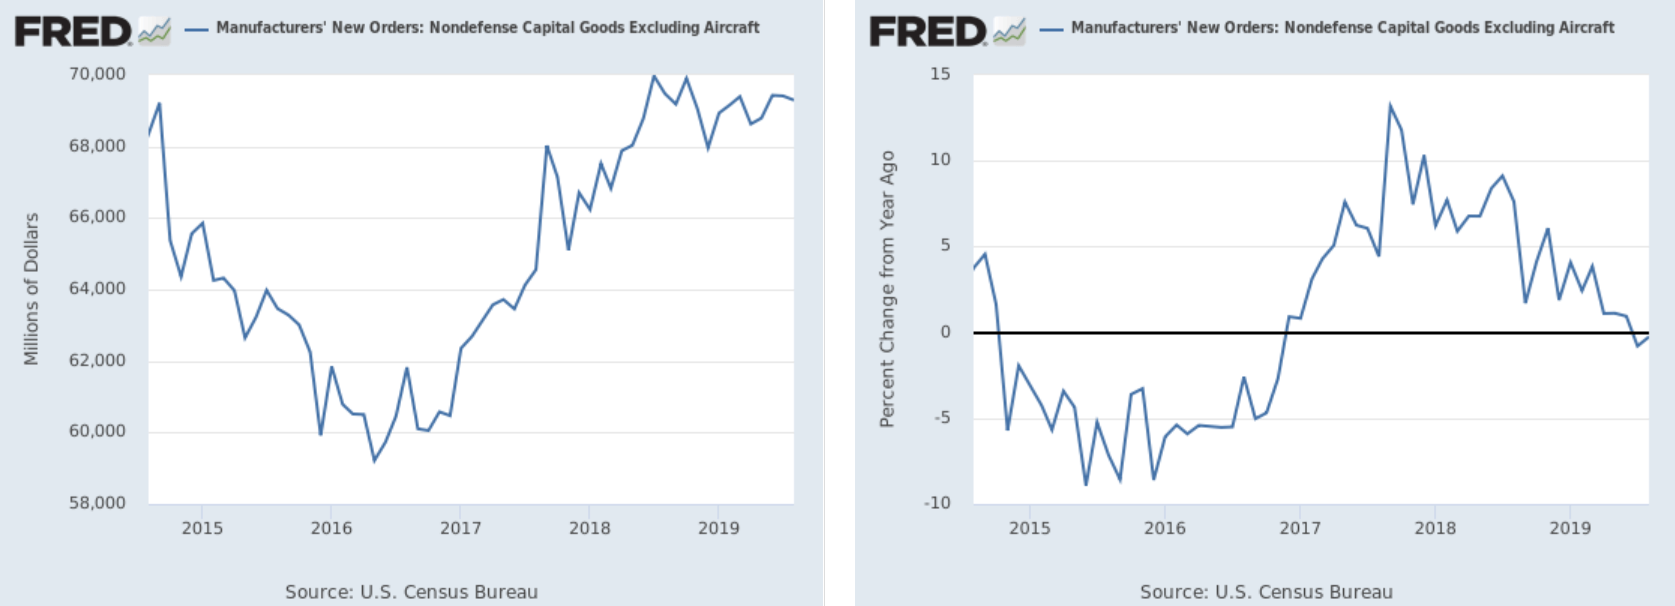
Finally, the Census released the latest durable goods numbers on Friday. Overall sales were up .2% M/M, while the ex-transportation number rose .5%. Let's look at three charts of the data:
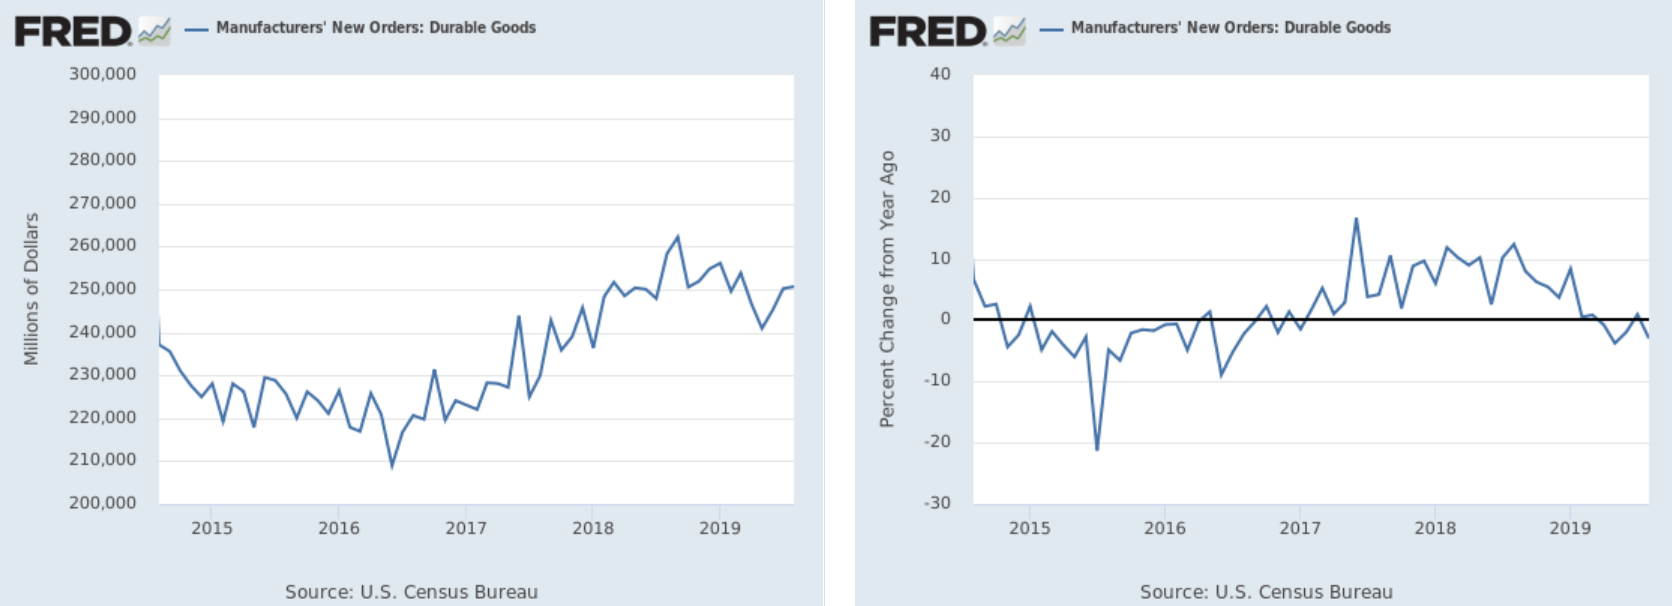
The headline number has been trending modestly lower since the middle of 2018 (right chart). The Y/Y percentage change (right chart) has been negative in four of the last five months. The Y/Y contraction isn't economically fatal - note the contraction in 2015-2016 that was caused by the price drop in oil. Yet, the economy continued to expand during this time.
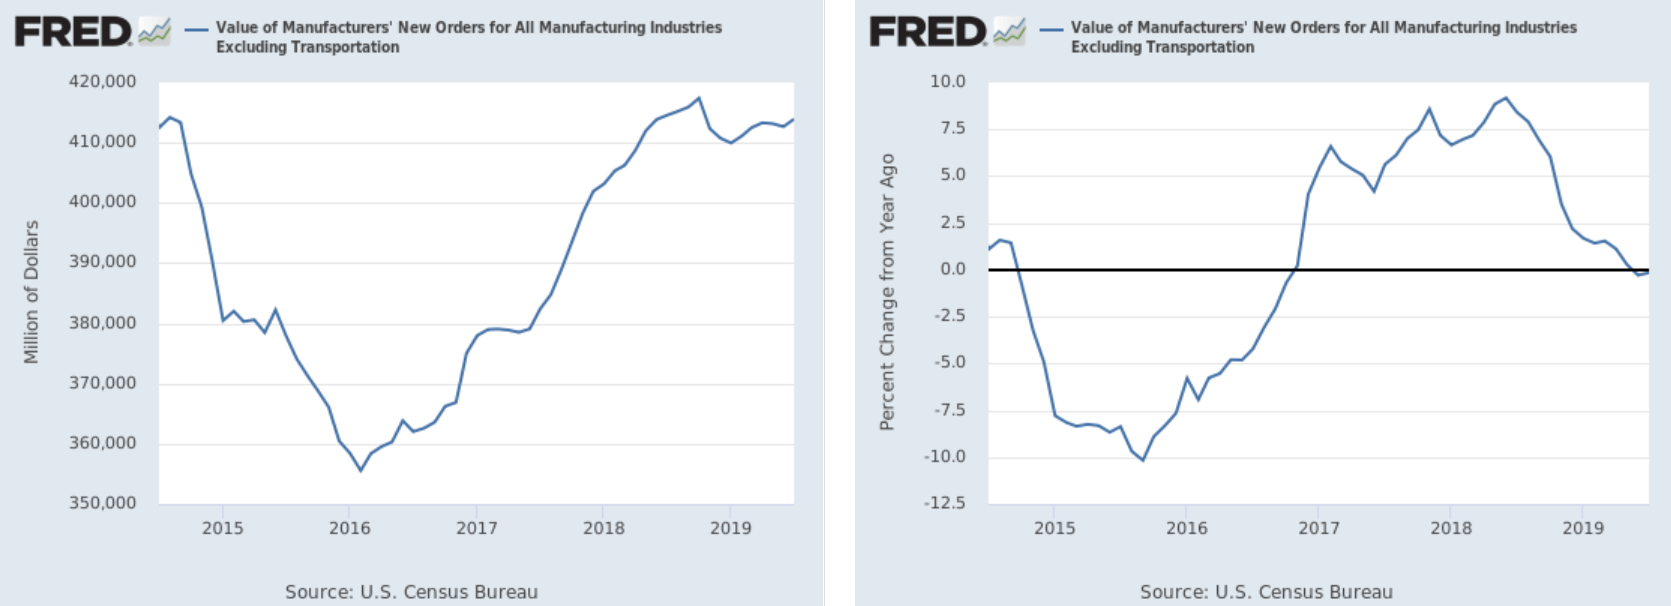
The ex-transport number has been trending sideways for the last six months (left chart). The Y/Y percentage change (right chart) is now modestly negative.
New orders of equipment have been moving sideways for the past year (left chart). The Y/Y rate of change has been modestly negative for the past few months.
US data conclusion: Overall, the economy is on good footing. The final reading of 2Q GDP showed a modest, consumer-led expansion, while the monthly personal income report showed that consumers are still spending at solid rates. There's some business investment weakness which is impacting durable goods orders, but the softness is modest.
US Markets
Let's look at this week's performance table:
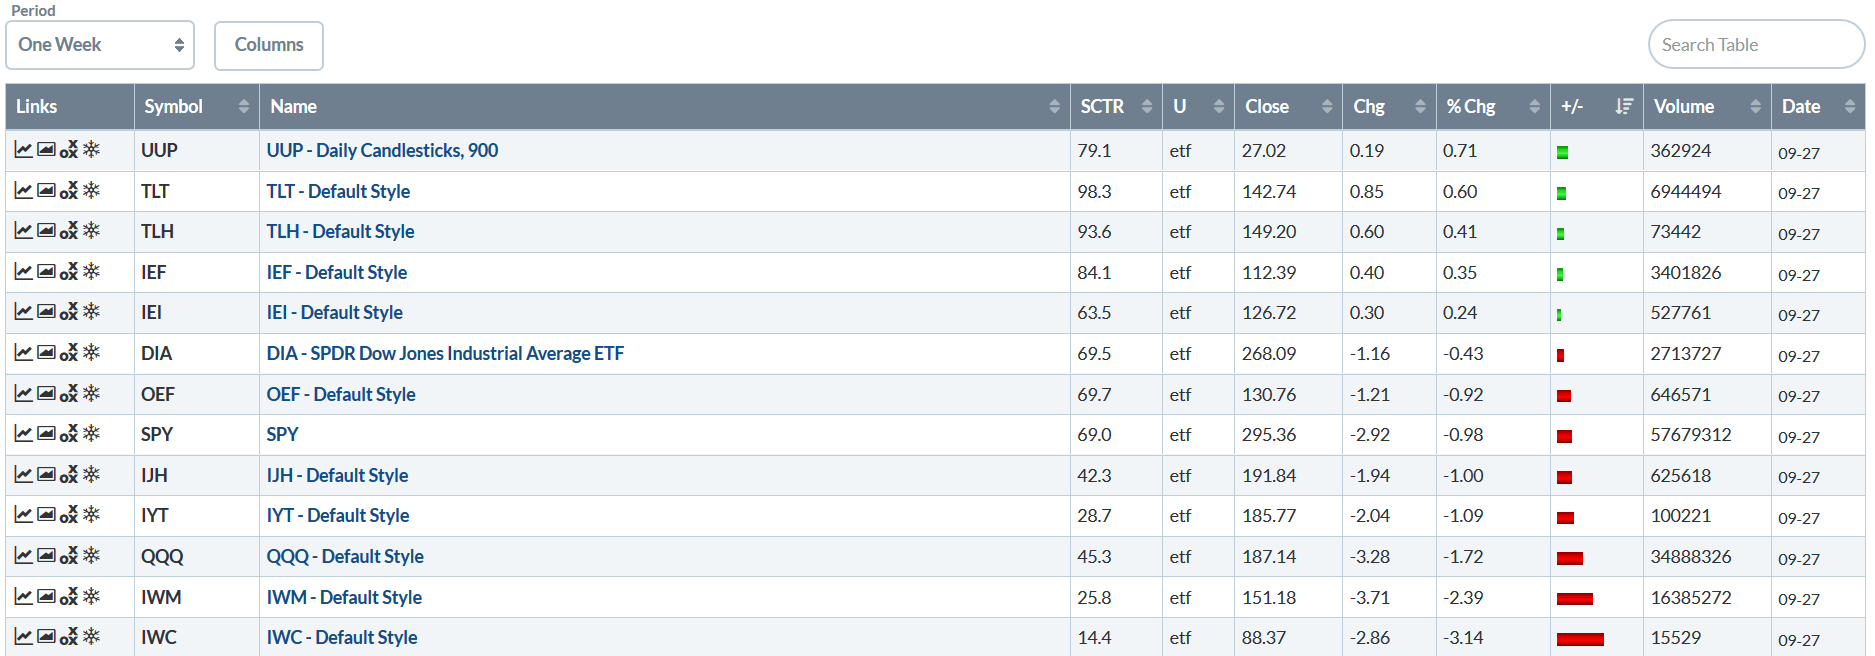
It was another defensive week for the markets - treasuries led the way higher, although they didn't gain that much. Large caps were down around 1%, and small caps dropped fairly sharply.
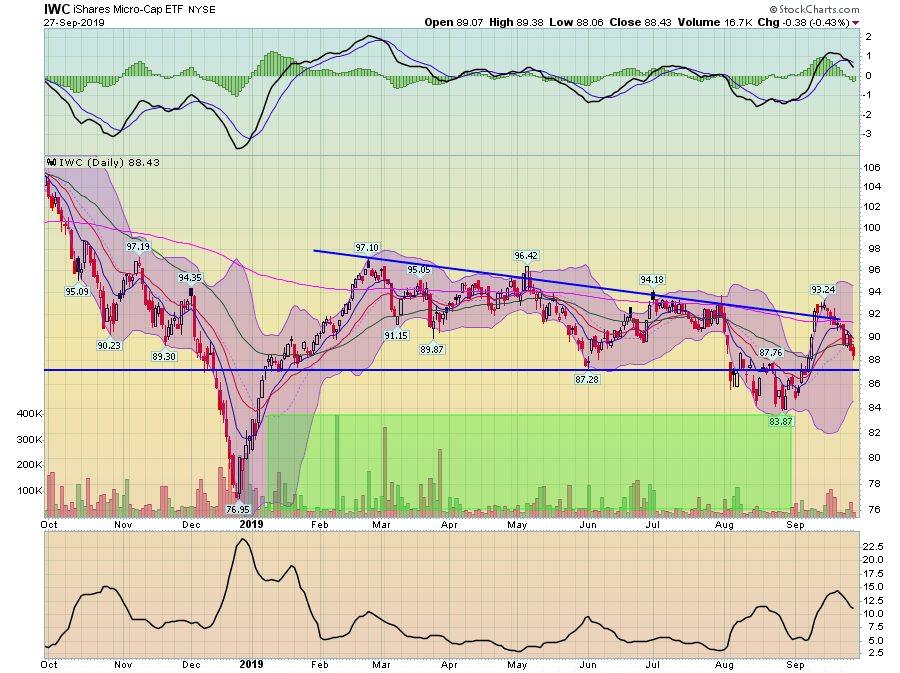
Several weeks ago, it looked like the markets might be on their way to making new highs. But since then, prices have fallen back.
Micro-caps broke through key resistance a few weeks ago but have fallen consistently since. Prices are once again below all the moving averages. After rising, momentum has now given a "sell" signal.
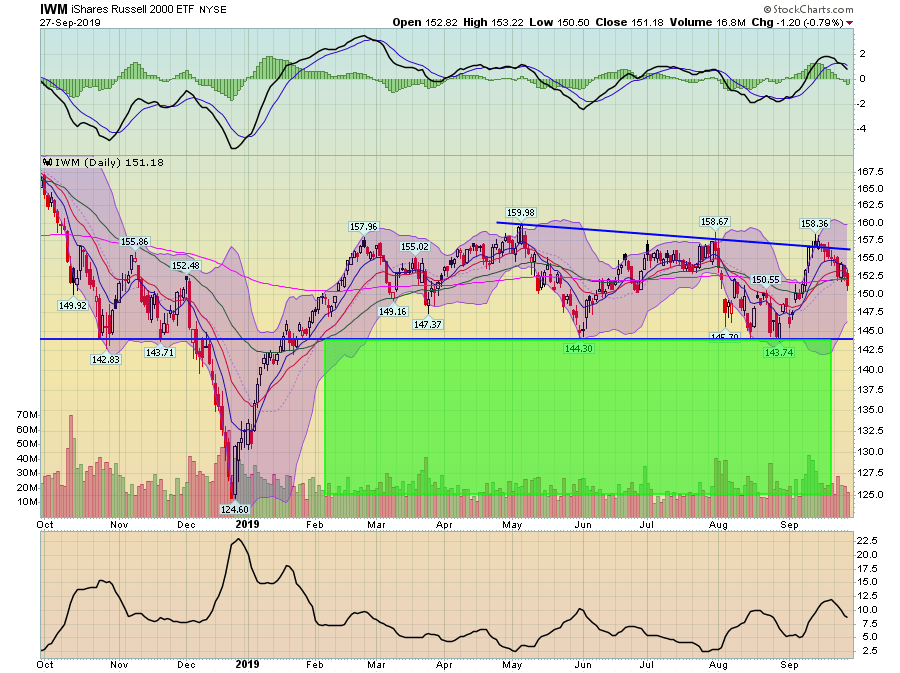
Small caps barely broke through resistance a few weeks ago. But like micro caps, they're pulled back as well. The IWMs MACD has already given a "sell" signal.
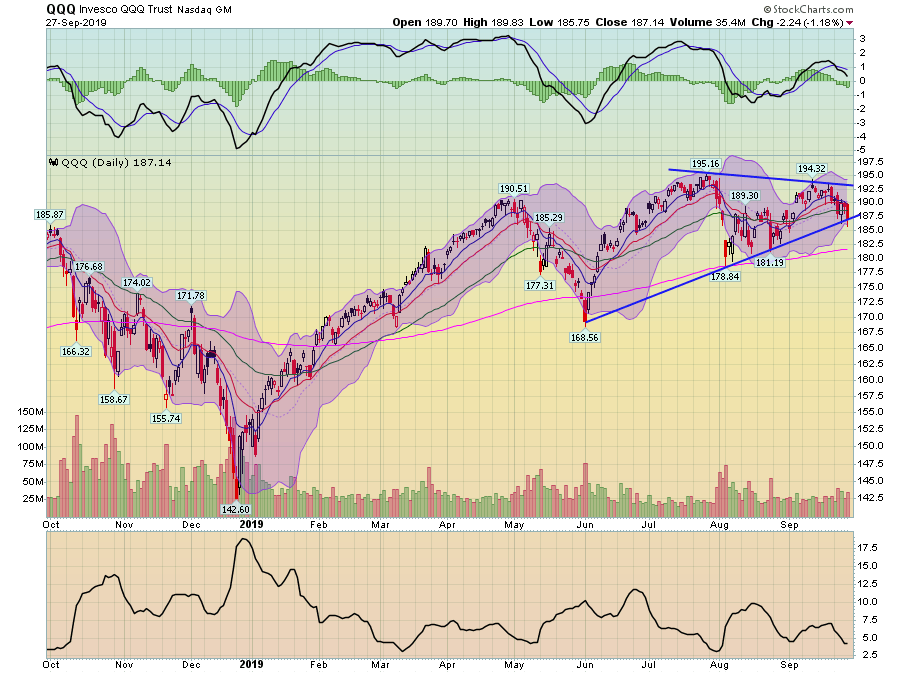
The QQQ is right at technical support after today's close. Momentum is also declining.
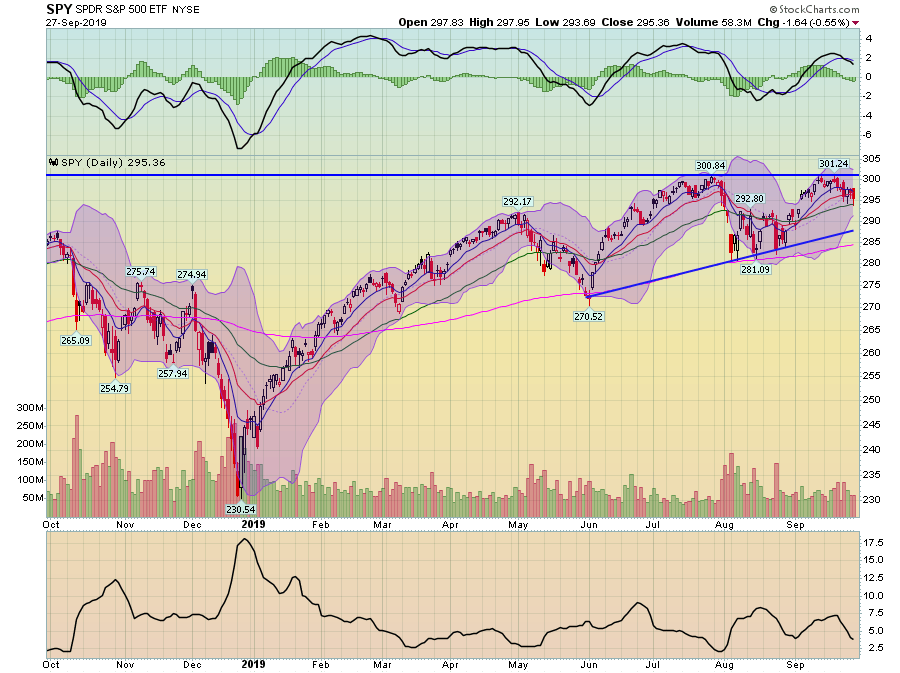
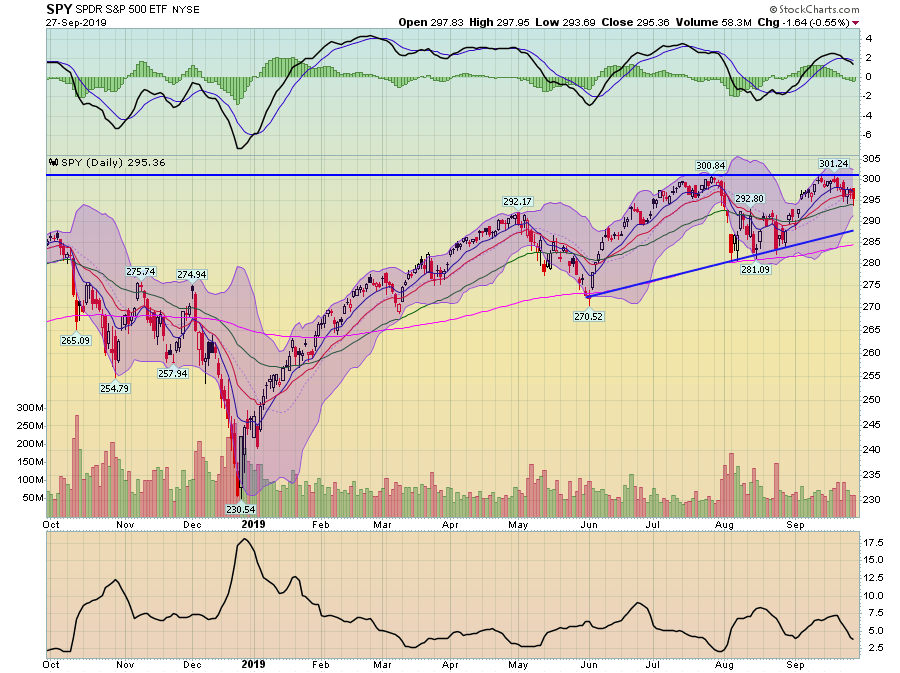
The SPYs have the best chart; it's down but is still using the shorter EMAs for technical support. But the MACD has also given a "sell" signal.
So, where do we leave the last full week of September? Fundamentally, we're in good shape. The economy is growing modestly, unemployment is low, and prices are contained. The market sell-off isn't fatal, either; it's more of a modest, disciplined sell-off variety instead of a "sell everything now" event. As we look into the final quarter of the year, things are pretty darn good.
