One cannot kill something that is already dead.
And one cannot kill this market, even though technically, many people think that it is already dead.
Bonaparte, our dead alive dog mascot, disguises his status by throwing an elegantly tied scarf around his neck.
Trust me, it fools people! (Or at least it fools our living dogs!)
Similarly, the market wears a vibrant scarf that keeps folks fooled into thinking it’s alive.
Even in the face of the constant onslaught of trade war news, every dip is bought.
However, the rallies are becoming shallower.
Perhaps we can say that the market’s rally is dead alive, currently buried in a very shallow grave.

Every Economic Modern Family character closed lower week to week with one interesting exception.
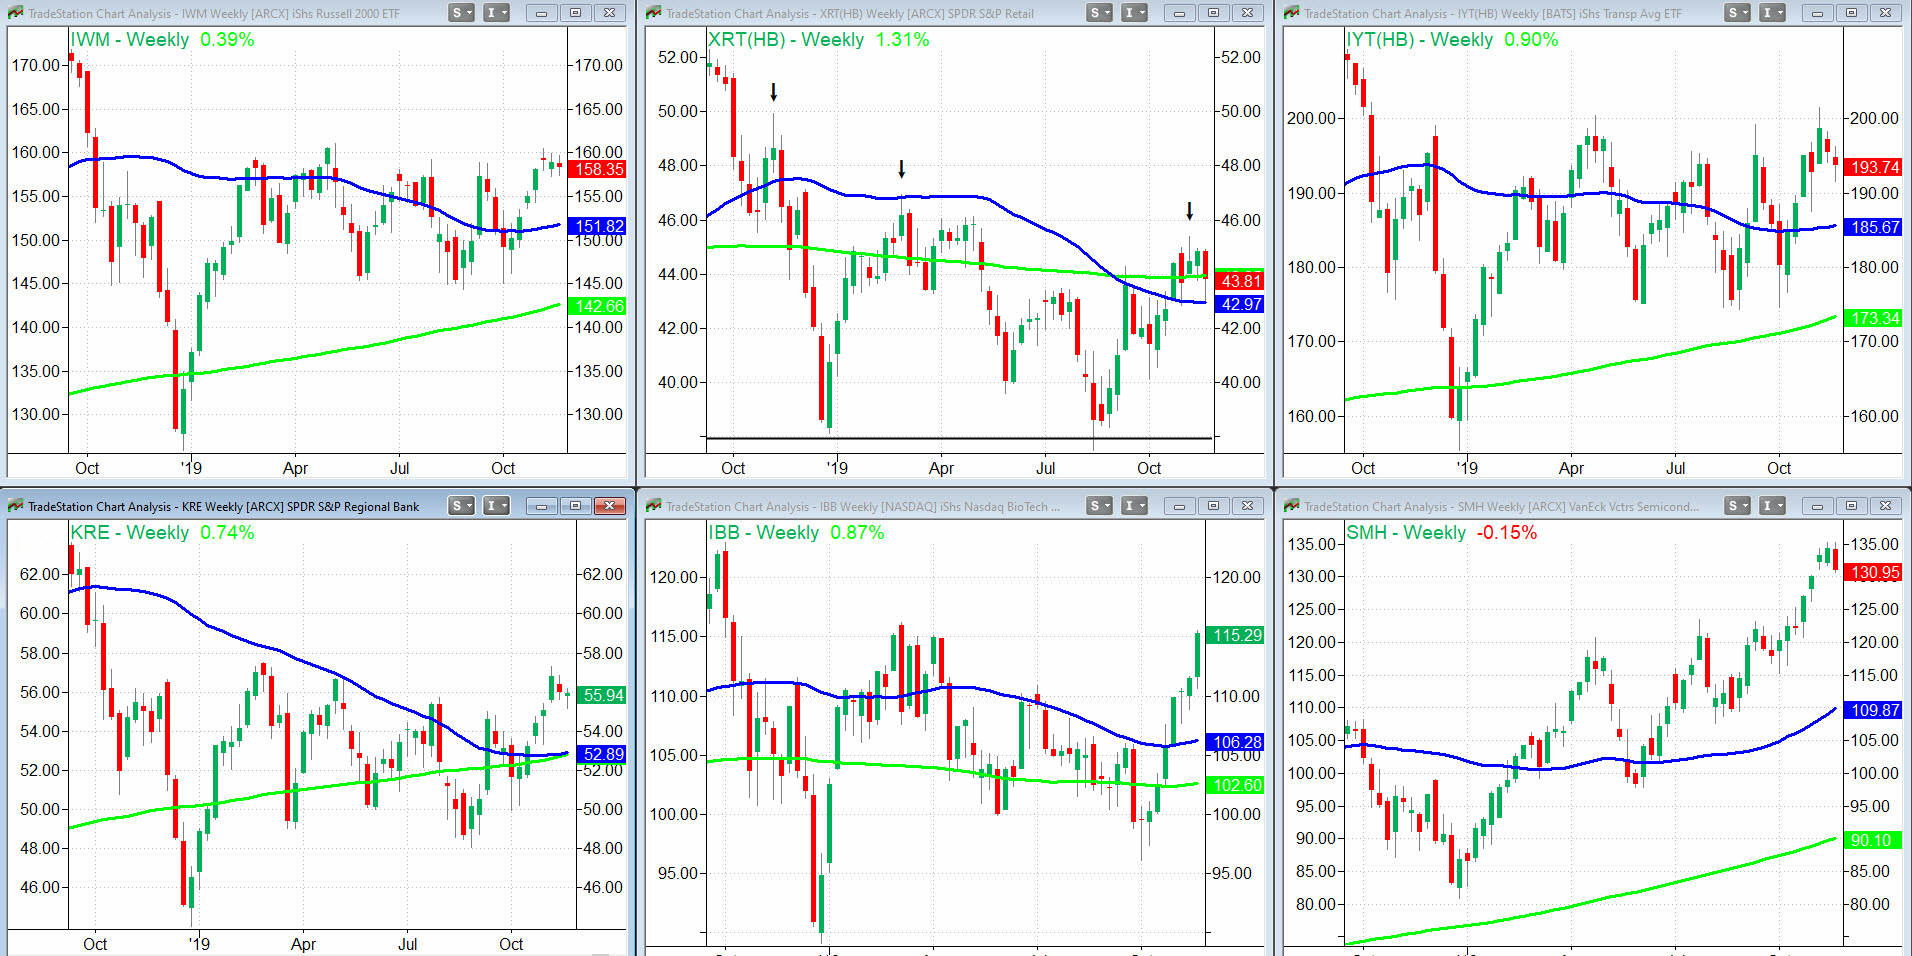
Top left is the Russell 2000 IWM. With an inside week under its scarf, the range to watch is 157.19-159.88.
Plus, IWM did close lower week to week, although marginally.
Middle top is Retail SPDR S&P Retail (NYSE:XRT). With most big retail names already done with earnings reports, all eyes look towards Black Friday.
XRT held on to the support level on the daily chart. On the weekly chart, it closed right on the 200-week MA (green). However, this too closed lower week to week, by a significant margin.
Top right is Transportation iShares Transportation Average (NYSE:IYT). That closed lower week to week by nearly $2.00. Therefore, by strictly percentages, this had the second worst performance of the bunch.
The underlying support in IYT holds though.
Bottom left is Regional Banks SPDR S&P Regional Banking (NYSE:KRE). One could make the argument for a bull flag. And, although it closed lower week to week, it only did so by a smidge.
Bottom middle is this week’s superstar, Big Brother Biotechnology iShares Nasdaq Biotechnology (NASDAQ:IBB). Lots of pharma stocks rallied. But remember, this sector is in the MF because of its reliable measure of investor sentiment. And, one should note, IBB is often the last sector to rally finding itself alone at the top.
Nevertheless, some digestion between 112-115 is healthy. And, with the 2019 high at 116.25, a push above that price after the holiday will be a good sign.
Finally, there is Sister Semiconductors VanEck Vectors Semiconductor ETF (NYSE:SMH). Not too much of a surprise that this sector would take a breather. SMH wins the prize for the worst performance week to week, ending lower by nearly $3.00. Do be on the lookout for even more selling as the chart pattern you see is called a bearish engulfing pattern.
Additionally, a gap below 130.14 that cannot recover, could leave an island top. How would that impact the rest of the market?
Well, considering that all closed lower besides IBB, think of our dead alive dog mascot.
Remove Bonaparte’s vibrant scarf, and all your left with are his bones.
S&P 500 (SPY) 310 pivotal especially on a closing basis. The suggestion for an interim top remains strong though, unless it takes out the all-time high 312.69.
Russell 2000 (IWM) 155-156 Key support. 157.75 Pivotal. 160.46 resistance.
Dow (DIA) Like SPY, the price action suggests an interim top unless it takes out the new all-time high at 280.84.
Nasdaq (QQQ) This closed under the 10-DMA or around 202. Support at 200.00. A gap higher Monday over 202 is a plus. All-time highs at 203.84.
KRE (Regional Banks) 54.00 support. Has to close over 56 to keep going
SMH (Semiconductors) 130.14 is the high of the day prior to when this gapped up leaving a breakaway gap. Should this gap lower than that, potential for an island top. Or at the very least a correction down to 125.00 area. 135.26 all-time high.
IYT (Transportation) 190 key support and back over 195 better.
IBB (Biotechnology) 112-116 range right now
XRT (Retail) 42.95-43.05 key support. Over 44 better.
