Monitoring purposes SPX: Sold SPX on 4/1/14 at 1885.52 = gain 1.78%; Long SPX on 3/26/14 at 1852.56.
Monitoring purposes GOLD: Gold ETF (ARCA:GLD) long at 173.59 on 9/21/11
Long Term Trend monitor purposes: Flat

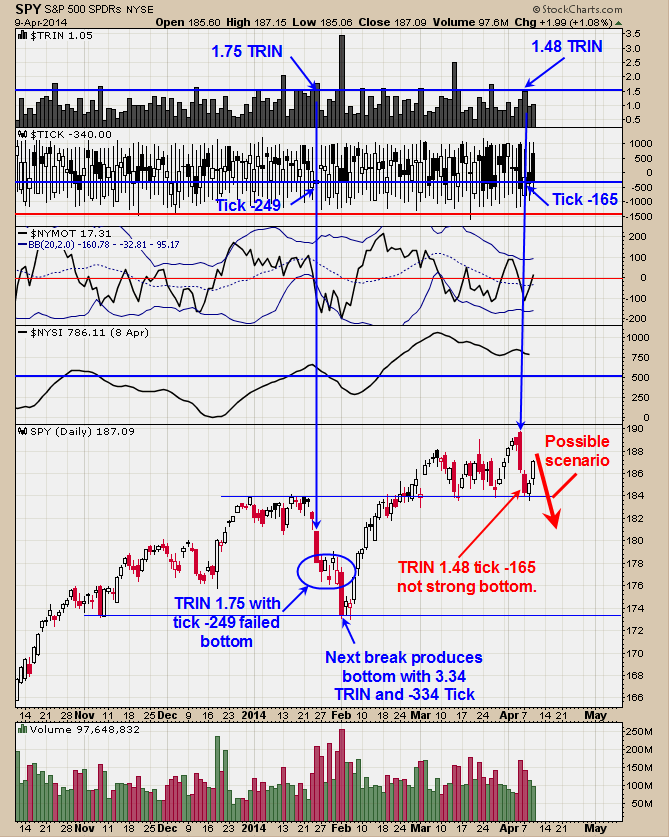
On April 7 the TRIN closed at 1.48 and the Ticks closed at -165 and not ideal readings for a short term bottom. We like to see the TRIN close above 1.50 and the Ticks close below -300 to determine that there is enough panic in the market for form a low and April 7 reading fell short. The last time the TRIN and Tick readings fell short of the ideal TRIN and Tick reading of 1.50 and -300 came on January 24. The market puttered around for a week than slammed into a low on February 3 where the TRIN reached 3.34 and ticks reached -334 (we went long on February 5). Market did rally the last two days but rally came on reducing volume and suggests upside energy is lessening. The week before option expiration week (this week) can produce a whip say or two and there is a chance one could be forming here. We will wait for better TRIN and Tick readings and will stay neutral for now.
The March 31 Timer Digest report showed us 5thfor the 3 months timeframe; ranked 9thon the 6 months timeframe and ranked 10thon the one year timeframe.

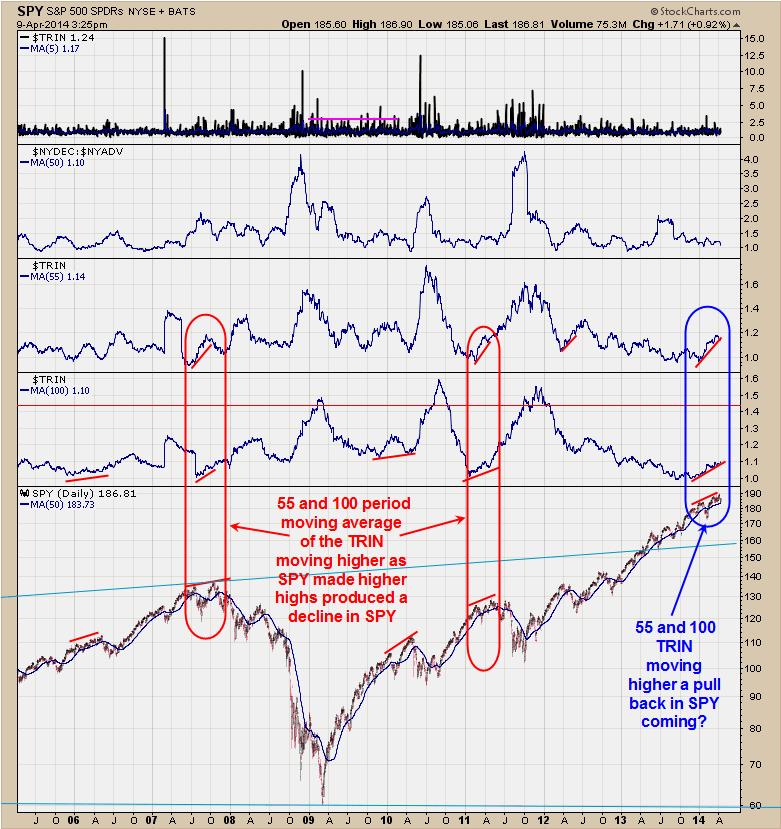
The chart above is the 55 and 100 period moving average of the TRN. The bottom window is the SPY. A bearish sign develops for the market when both the 55 and 100 period moving average of the TRIN moves higher as the SPY is moving higher. We have circled in Red the previous two times this condition was present going back to mid 2005. Both the 2007 and 2011 tops in the SPY had the 55 and 100 day TRIN rising. The current market has the 55 and 100 period TRIN rising since early January and the SPY has been making higher highs since January and a bearish sign. Not all indicators work all the time and this current bearish setup on the TRIN may pass with out producing a decline in the SPY. But for now we are being cautious.

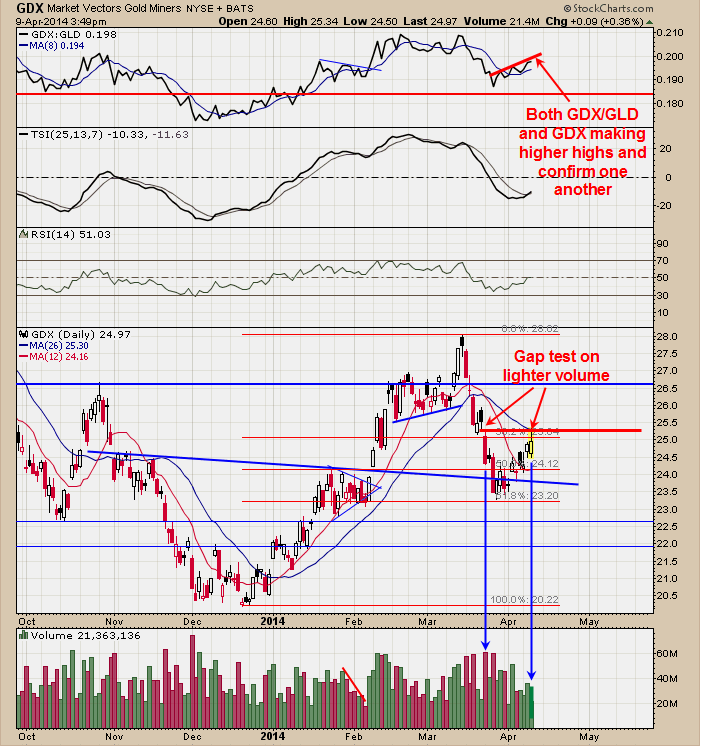
Today Market Vectors Gold Miners (ARCA:GDX) ran into the down gap of March 24 on much lighter volume and suggest the gap range at 25.22 has resistance. We will have to wait a day or two to see if GDX can push through this gap and if not than market may pull back down to the previous low near 23.50. The top window is the GDX/GLD ratio and it has been rising along with GDX and that condition confirms the uptrend in GDX. If the market does pull back here and test the previous low near 23.50 on GDX, most likely both the “True Strength index” and GDX/GLD ratio will produce positive divergence and a bullish setup. Staying neutral for now.
Long GDX at 23.65 on 2/7/14; sold 2/13/14 at 25.44 = 7.6%. Long GDX at 21.83 (1/7/14) sold 1/24/14 at 23.90, gain 9.5%. Long NG at 5.14 on 10/8/12. Long GDX 58.65 on 12/6/11. Long Market Vectors Junior Gold Miners (ARCA:GDXJ) average 29.75 on 4/27/12. Long GLD at 173.59 on 9/21/11. Long YNGFF .44 on 7/6/11. Long EGI at 2.16, on 6/30/11. Long LODE at 2.85 on 1/21/11. Long UEXCF at 2.07 on 1/5/11. We will hold as our core position in AUQ, CDE and KGC because in the longer term view these issues will head much higher. Holding CDE (average long at 27.7.Long cryxf at 1.82 on 2/5/08.KGC long at 6.07. Long AUQ average of 8.25.
For examples in how "Ord-Volume" works, visit www.ord-oracle.com. New Book release "The Secret Science of Price and Volume" by Timothy Ord, buy on www.Amazon.com
